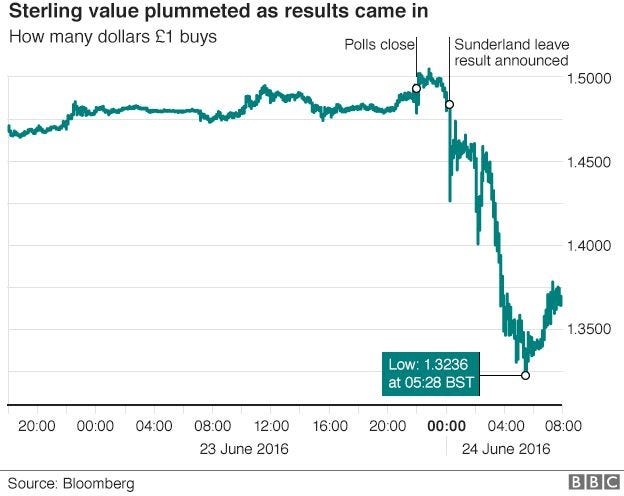
See Behind the FX rate
Dec 29, 2019 · 4 min read

As a beginner in Python, I am eager to find interesting projects to play with. In this article, I will introduce a Python project that I found quite intriguing and practical with the finance terms explained in plain language.
Living in the UK for the past year, it has been difficult for me to not become tired about the Brexit. Be it the higher overseas traveling expense or the 2% more that I have to spend on groceries(Guardian), the weakening pound driven by Brexit has taken its toll on my life.
The aforementioned loss incurred by the currency fluctuations is jargoned ‘FX exposure’ in finance.

Let's start the project with a question — If you’d like to convert some money to another currency on a future date, how could you monitor your FX exposure?
Well, you could try to track the live FX rates and exchange the money when the rate dropped. But with so many agents in the market, how could we know which one offers the most competitive rates? And is there any more could we learn from the provided FX rates?
Thus this Python project will focus on: 1. Tracking the live FX rates provided by various agents using html requests 2. Comparing and analysing the rates offered using trend plot First, let start with a FX trading site that you like.
I went with two major Chinese banks — Bank Of China and China Merchant Bank.
Below are the site content for the two Banks I choose.
Bank Of China — FX rate
China Merchant Bank — FX rate
If you were familiar with CSS/HTML (don’t panic if not), then you would notice — they are both in the form of tables.
Simply speaking , if you open the link (click me!) in Chrome, right-click and choose ‘inspect’. You would see the below which shows the website code. Hovering your mouse over the FX rate section on the screen, you would have uncovered an html table!
In short, an html table element on any page could be converted to a Pandas dataframe using pd.read_html().
As one of the banks only provides real-time data, i have to make a request to the website every 15 mins and store the table data into excel. I used the below code to do the job but i am sure there are many ways to get the data as well!
Leave the code to run for a day or two to collect the data, afterwards you could start the analysis .
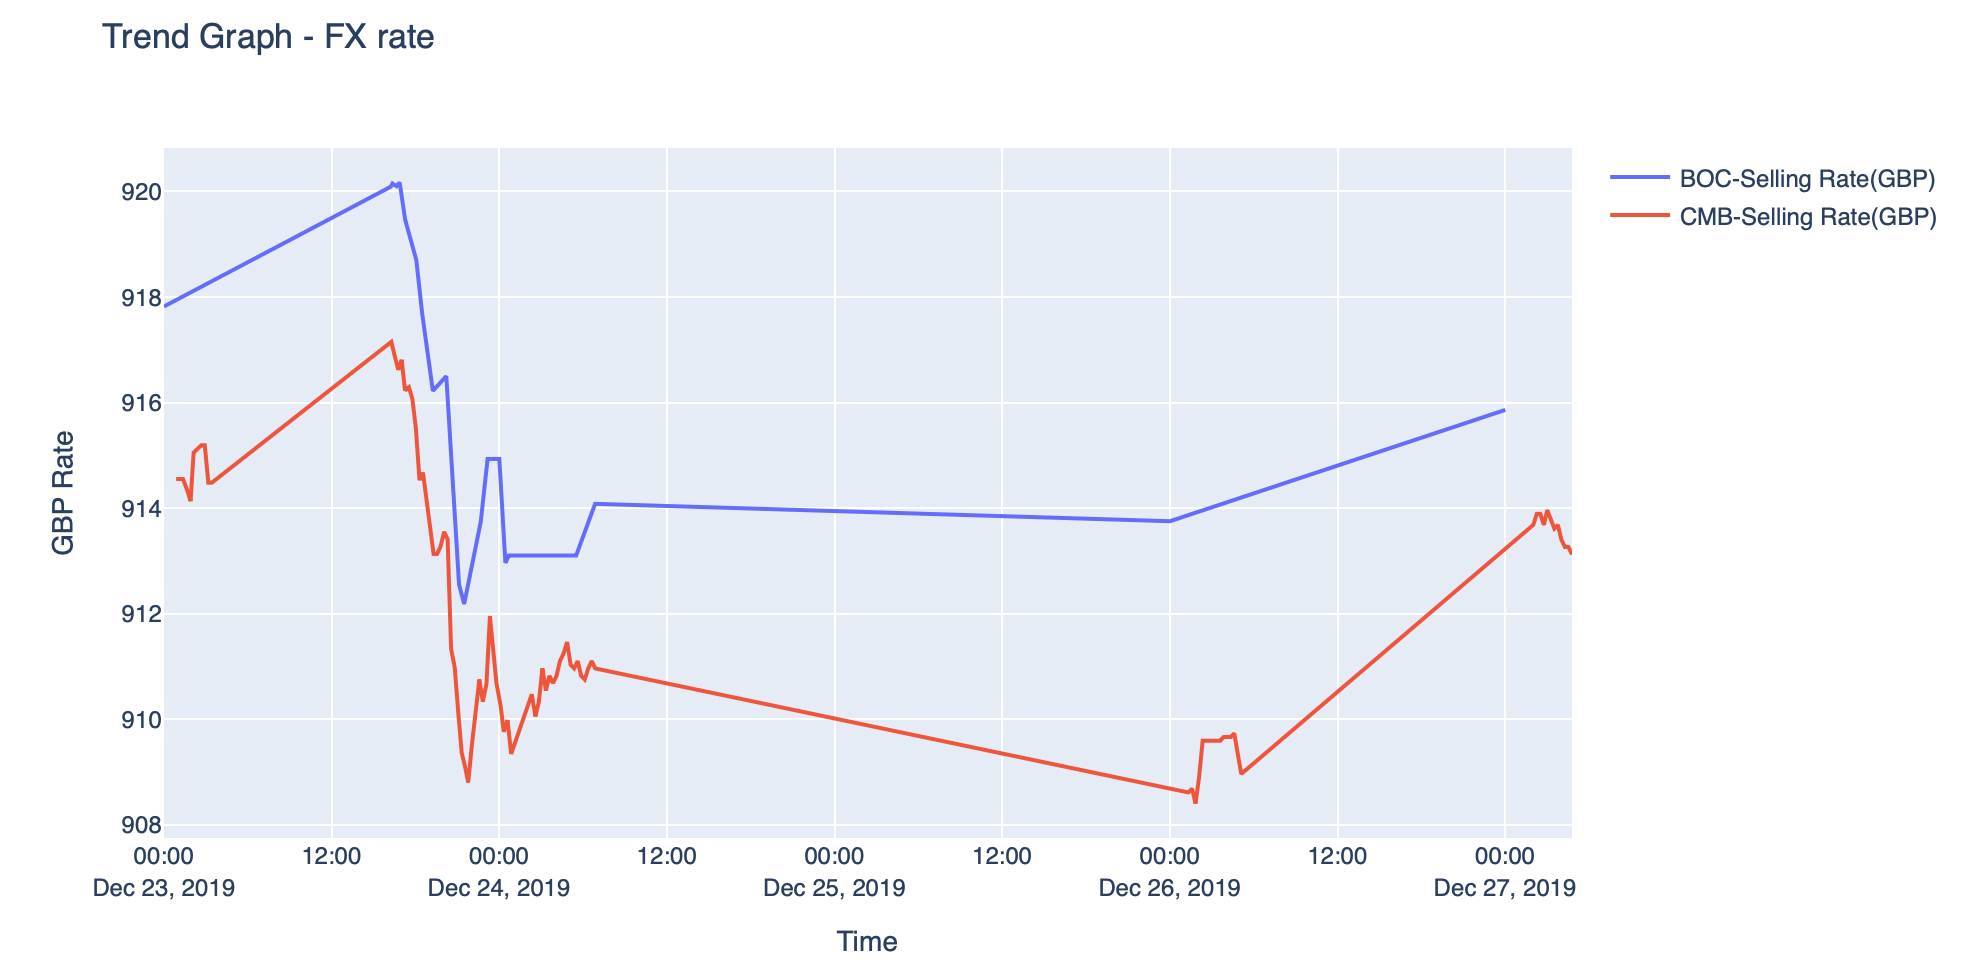
By plotting line chart as per below, you could check which banks offer a better rates — in my case, it is the China Merchant Bank. As it consistently offered a lower rate throughout the time (lower rates means more RMB could be bought with a same amount of GBP).
Also by looking at this graph, it seems that the best time to convert GBP to RMB are 26th Dec 0:00(with CMB) when the rates is at the lowest. But this decision is made retrospectively when we already the full information.
In real life, we would not have any knowledge if the pound is going to drop further after 26th Dec . A stop-loss could help us to mitigate the FX exposure — where you place an order with an broker to sell when a certain price is reached (full definition).
It also seems like that both banks are charging relatively consistent spreads (the difference between selling and buying rate which could be seems as profit margin for agents) across the days. But in comparison, Bank of China are charging higher spreads than China Merchant Bank as calculated below.
With the FX data at hand, there are more that we could do , for example : 1. We could verify if China Merchant Bank is offering the more competitive rates across the currencies for both selling and buying 2. there are two dips in the plotted graph, are them being driven by certain financial event? etc.
Since I am a beginner as well, I welcome your feedback !
Last updated