10 Pandas tips
10 Pandas tips to make data analysis faster
1. Styling
Have you ever complained about the table output looks boring when you do .head() in Jupyter notebooks? Is there a way not to display indexes (especially when there is already an ID column)? There’re ways to fix these issues.
A. Highlight all negative values in a dataframe. (example revised from https://pandas.pydata.org/pandas-docs/stable/user_guide/style.html)
import pandas as pd
def color_negative_red(val):
    color = 'red' if val < 0 else 'black'
 return 'color: %s' % colordf = pd.DataFrame(dict(col_1=[1.53,-2.5,3.53],
                       col_2=[-4.1,5.9,0])
                 )
df.style.applymap(color_negative_red)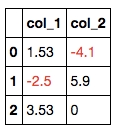
B. Hide the index. Try df.head().style.hide_index()!
C. Add hovering effects. (example revised from https://pandas.pydata.org/pandas-docs/stable/reference/api/pandas.io.formats.style.Styler.set_table_styles.html)
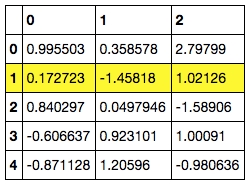
D. More CSS styles. You can use CSS to change the appearance of the table.

2. Pandas options
The reader may have experienced the following issues when using .head(n) to check the dataframe:
(1) There’re too many columns / rows in the dataframe and some columns / rows in the middle are omitted.
(2) Columns containing long texts get truncated.
(3) Columns containing floats display too many / too few digits.
One can set
to solve these issues.
3. Group by with multiple aggregations
In SQL we can do aggregations like
In Pandas it can be done with .groupby() and .agg():
And the result will look like this:
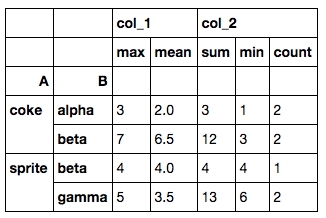
Both the rows and columns are multi-indexed. A quick solution to change it to a dataframe without multi-indices is
If you would like to have the column renaming process automated, you can do tbl.columns.get_level_values(0) and tbl.columns.get_level_values(1) to extract the indices in each level and combine them.
4. Column slicing
Some of you might be familiar with this already, but I still find it very useful when handling a dataframe with a ton of columns.
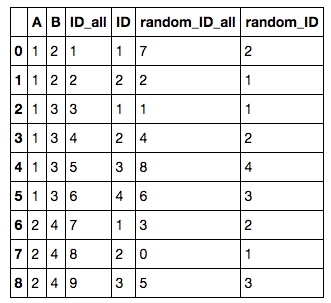
5. Add row ID / random row ID to each group
To add a row ID / random row ID for each group by A, B, one can first append an ID / random ID to all rows:
To add a random ID to each group (by A, B), one can then do
to get
6. List all unique values in a group
Sometimes after we performed group by, we’d like to aggregate the values in the target column as a list of unique values instead of max, min, …etc. This is how it’s done.
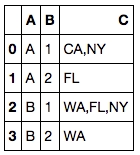
If you’d like to save the result, don’t forget to change the separator to anything other than commas.
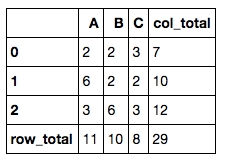
7. Add row total and column total to a numerical dataframe
This is another common data manipulation. All you need is .apply().
8. Check memory usage
`.memory_usage(deep=True)` can be used on Pandas dataframes to see the amount of memory used (in bytes) for each column. It’s useful when building machine learning models which may require a lot memory in training.
9. Cumulative sum
From time to time, cumulative sum is required when you generate some statistical outcomes. Simply do `
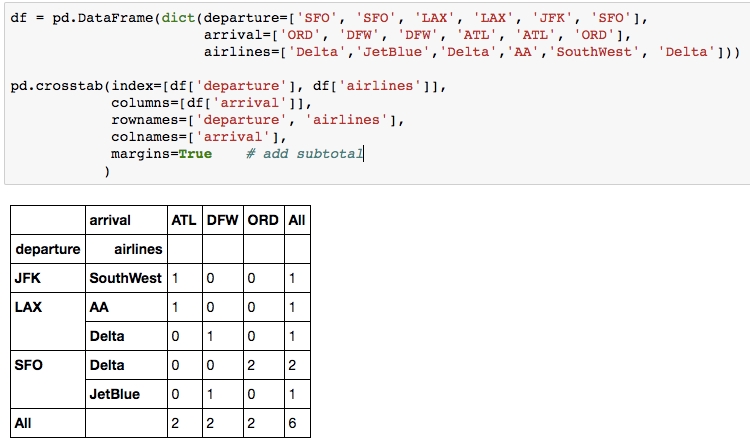
10. Crosstab
When you need to count the frequencies for groups formed by 3+ features, pd.crosstab() can make your life easier.
Thanks for reading! Comment below if you find bugs / better solutions.
Last updated
Was this helpful?