# Pandas\_UI
## Pandas\_UI เครื่องมือจัดการ Pandas DataFrame แบบง่าย ๆ

ใน ep ที่แล้ว เราใช้ [Pandas Profiling](https://www.bualabs.com/archives/2297/exploratory-data-analysis-eda-pandas-profiling-pandas-dataframe-pandas-ep-6/) ในการช่วยทำการสำรวจข้อมูล Exploratory Data Analysis (EDA) แต่ถ้าเราต้องการเปลี่ยนแปลงข้อมูลนิด ๆ หน่อย ๆ หรือเราต้องการพล็อตกราฟที่ใน Pandas Profiling ไม่มีมาให้ล่ะ จะทำอย่างไร เราสามารถใช้ Pandas\_UI มาช่วยได้
### Pandas\_UI คืออะไร
Pandas\_UI คือ เครื่องมือหน้าจอ User Interface Tools ที่ช่วยอำนวยความสะดวกให้เราสามารถจัดการ และแก้ไขข้อมูลใน Pandas DataFrame ได้อย่างรวดเร็ว และง่ายดาย
เราสามารถเลือก Row, Column, เงื่อนไข และ Operation ที่ต้องการใน Pandas\_UI จะช่วย Generate Code ภาษา Python ให้เรา โดยที่เราไม่ต้องจำชื่อฟังก์ชัน ชื่อพารามิเตอร์ต่าง ๆ
Pandas\_UI ถูกสร้างด้วยเทคโนโลยีที่เราคุ้นเคย เช่น NumPy, plotly, ipywidgets, pandas\_profiling, qgrid โดยสร้างเป็น Jupyter Notebook Extension ทำให้สามารถรันใน [Jupyter Notebook](https://www.bualabs.com/archives/182/introduction-to-jupyter-notebook-ep-1/) ได้เลย
### เรามาเริ่มกันเลยดีกว่า
ด้วย Code เพียงแค่ 3 บรรทัด
```python
pip install pandas_ui
jupyter nbextension enable --py qgrid --sys-prefix
jupyter nbextension enable --py widgetsnbextension --sys-prefix
```
[](https://colab.research.google.com/github/gnoparus/bualabs/blob/master/nbs/23b_eda_pandas_ui.ipynb)[Check it out on github](https://github.com/gnoparus/bualabs/blob/master/nbs/23b_eda_pandas_ui.ipynb) Last updated: 02/07/2020 11:16:12
ใน ep ที่แล้ว เราใช้ Pandas Profiling ในการช่วยทำการสำรวจข้อมูล Exploratory Data Analysis (EDA) แต่ถ้าเราต้องการเปลี่ยนแปลงข้อมูลนิด ๆ หน่อย ๆ หรือเราต้องการพล็อตกราฟที่ใน Pandas Profiling ไม่มีมาให้ล่ะ จะทำอย่างไร เราสามารถใช้ Pandas\_UI มาช่วยได้
## Pandas\_UI คืออะไร
Pandas\_UI คือ เครื่องมือหน้าจอ User Interface Tools ที่ช่วยให้เราสามารถจัดการ และแก้ไขข้อมูล Pandas DataFrame ได้อย่างสะดวก และรวดเร็ว
เราสามารถเลือก Row, Column, เงื่อนไข และ Operation ที่ต้องการใน Pandas\_UI จะช่วย Generate Code ภาษา Python ให้เรา โดยที่เราไม่ต้องจำชื่อฟังก์ชัน ชื่อพารามิเตอร์ต่าง ๆ
Pandas\_UI ถูกสร้างด้วยเทคโนโลยีที่เราคุ้นเคย เช่น NumPy, plotly, ipywidgets, pandas\_profiling, qgrid โดยสร้างเป็น Jupyter Notebook Extension ทำให้สามารถรันใน Jupyter Notebook ได้เลย
## 0. Install
ติดตั้ง Library pandas\_ui และ Enable Jupyter Notebook Extension ให้เรียบร้อยIn \[1]:
```
# ! pip install pandas_ui -q
# ! pip install fastai2 -q
```
In \[2]:
```
# ! jupyter nbextension enable --py qgrid --sys-prefix
# ! jupyter nbextension enable --py widgetsnbextension --sys-prefix
```
## 1. Import
Import Library ที่เราติดตั้งไว้ด้านบนIn \[3]:
```python
from pandas_ui import *
from fastai2.basics import *
```
## 2. Data
ในเคสนี้เราจะใช้ Dataset ที่เป็นข้อมูลแบบ Tabular จาก Adult DatasetIn \[4]:
```python
path = untar_data(URLs.ADULT_SAMPLE)
```
ลอง ls ดูว่ามีไฟล์อะไรบ้างIn \[5]:
```python
path.ls()
```
Out\[5]:
```
(#3) [Path('/home/keng/.fastai/data/adult_sample/export.pkl'),Path('/home/keng/.fastai/data/adult_sample/models'),Path('/home/keng/.fastai/data/adult_sample/adult.csv')]
```
## 3. Explore Data
สั่งเปิดไฟล์ CSV ได้เลยIn \[6]:
```
# pandas_ui??
```
In \[9]:
```python
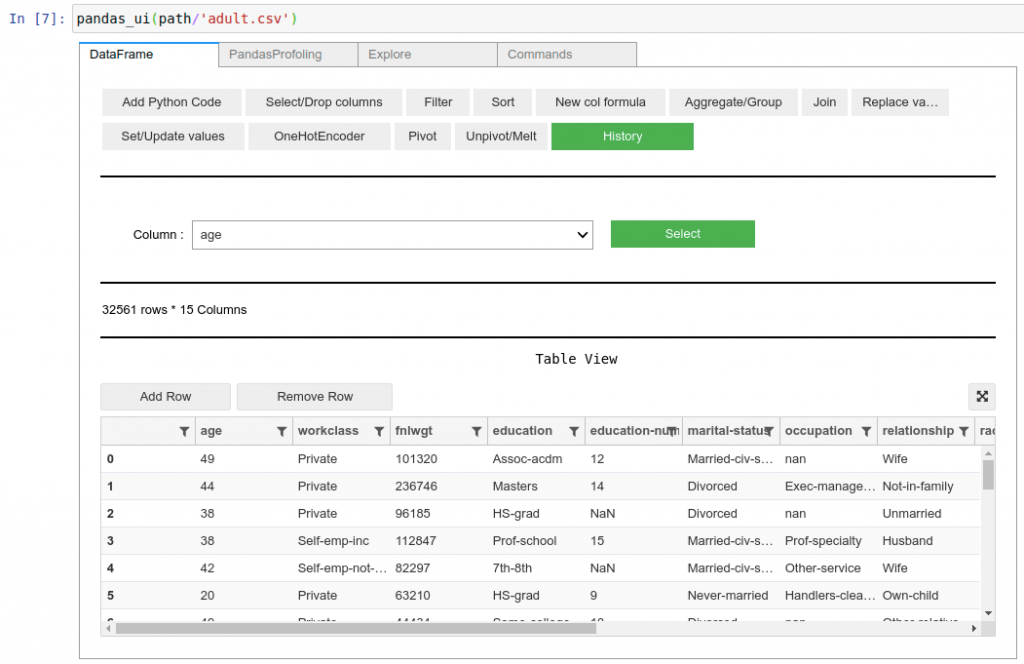
pandas_ui(path/'adult.csv')ตัวอย่างหน้าจอการใช้งาน
```
หน้าจอหลัก

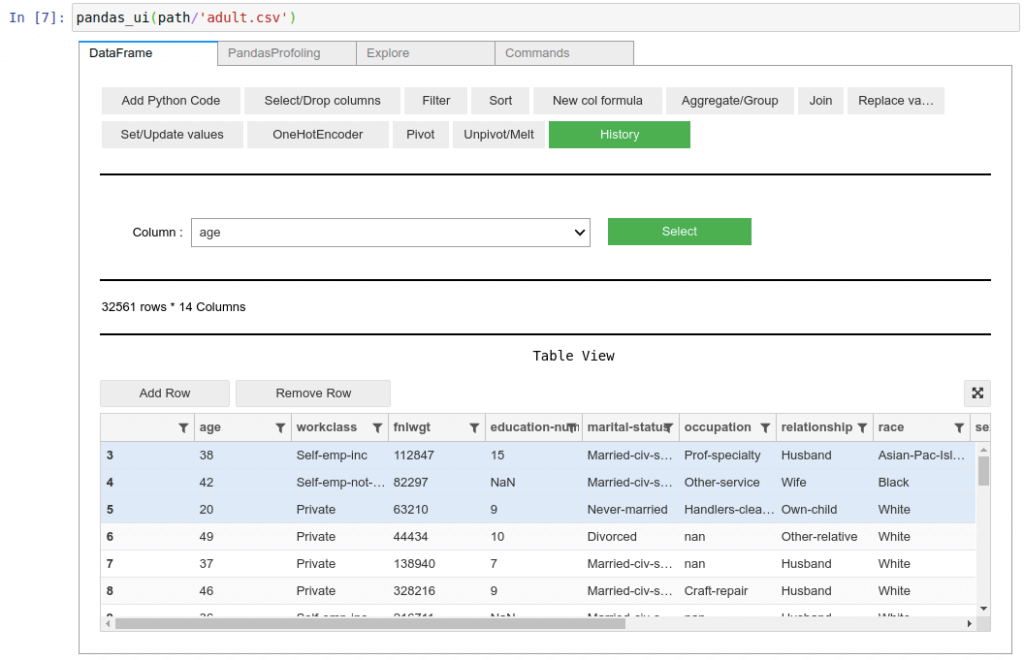
ลบ Row ที่เลือกไว้
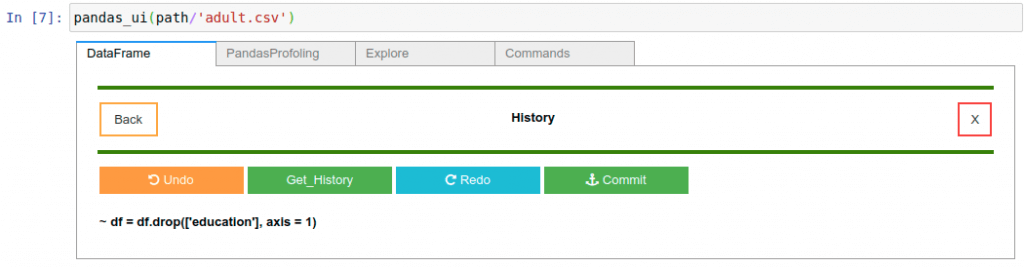
ประวัติการแก้ไข เราสามารถนำโค้ด Python ที่ Generate มาให้ไปใช้ต่อได้เลย
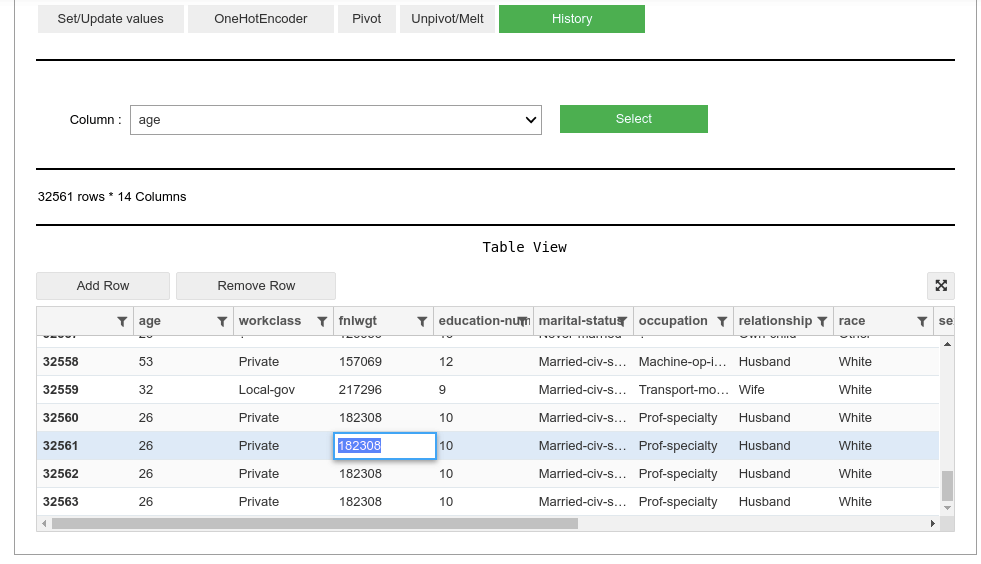
แก้ไขข้อมูลใน DataFrame โดยตรง
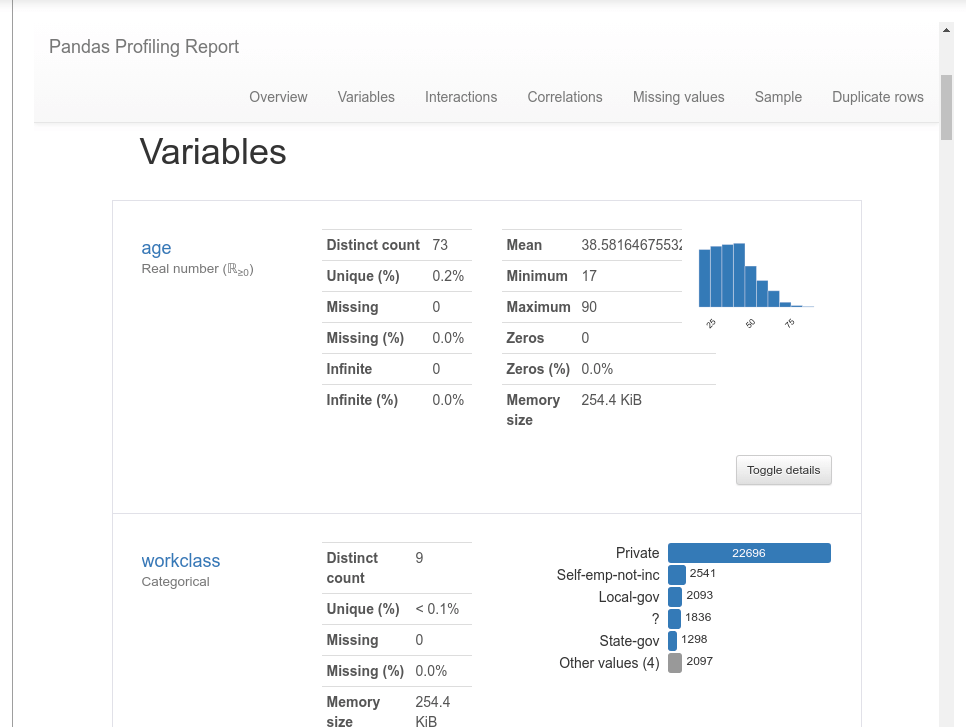
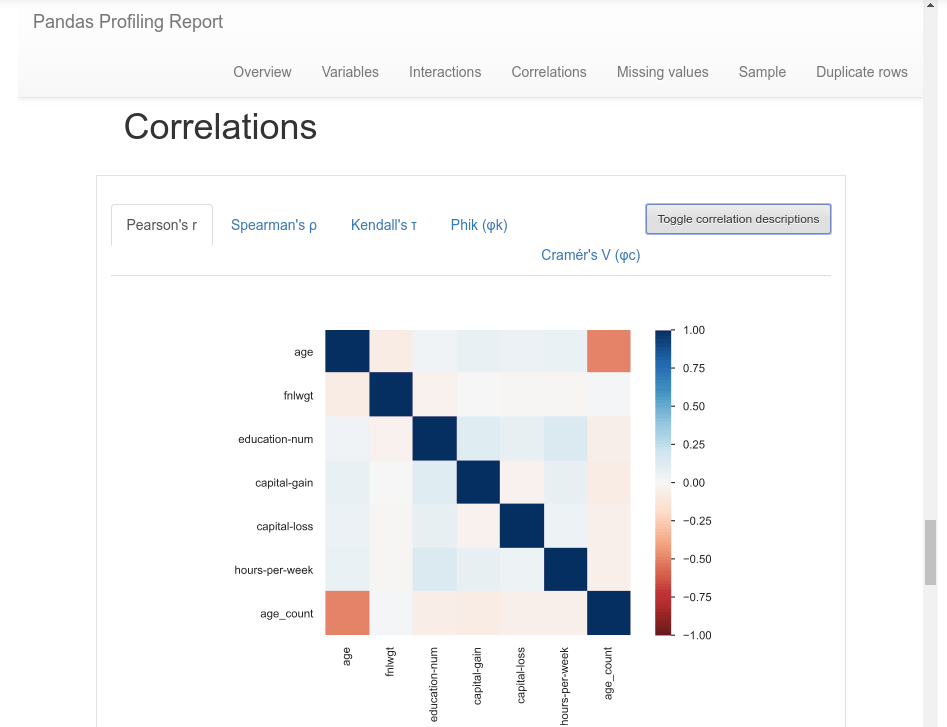
มีฟังก์ชัน [Pandas Profiling](https://www.bualabs.com/archives/2297/exploratory-data-analysis-eda-pandas-profiling-pandas-dataframe-pandas-ep-6/) Report ในตัว
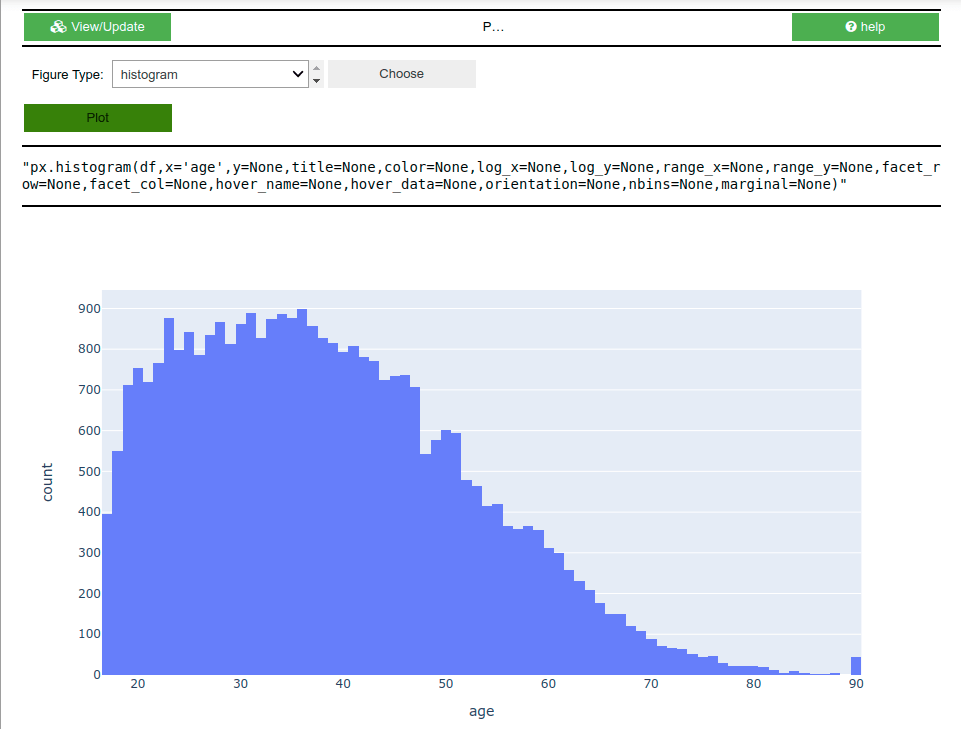
เลือก 1 Column มาพล็อต Histogram เราสามารถนำโค้ด ภาษา Python ที่ Generate มาให้ไปใช้ต่อได้เลย
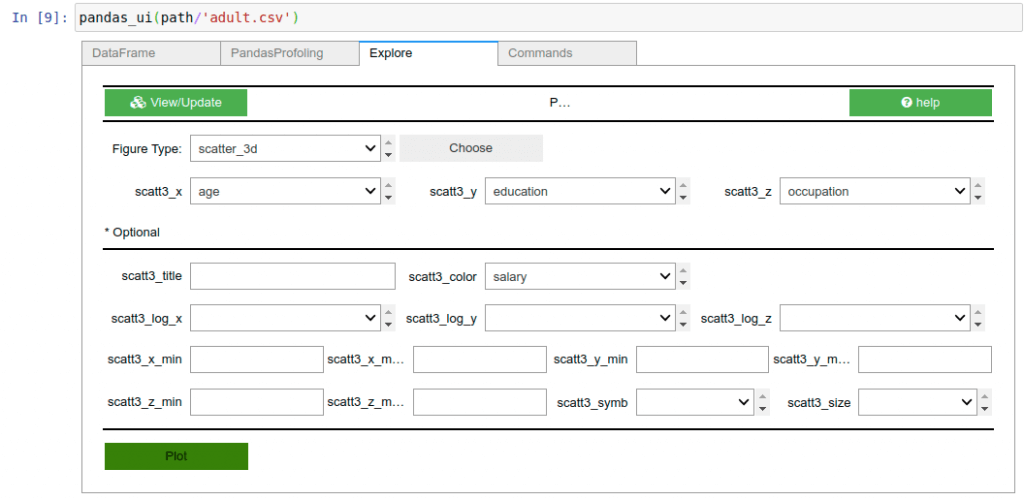
รองรับกราฟ 3 มิติ
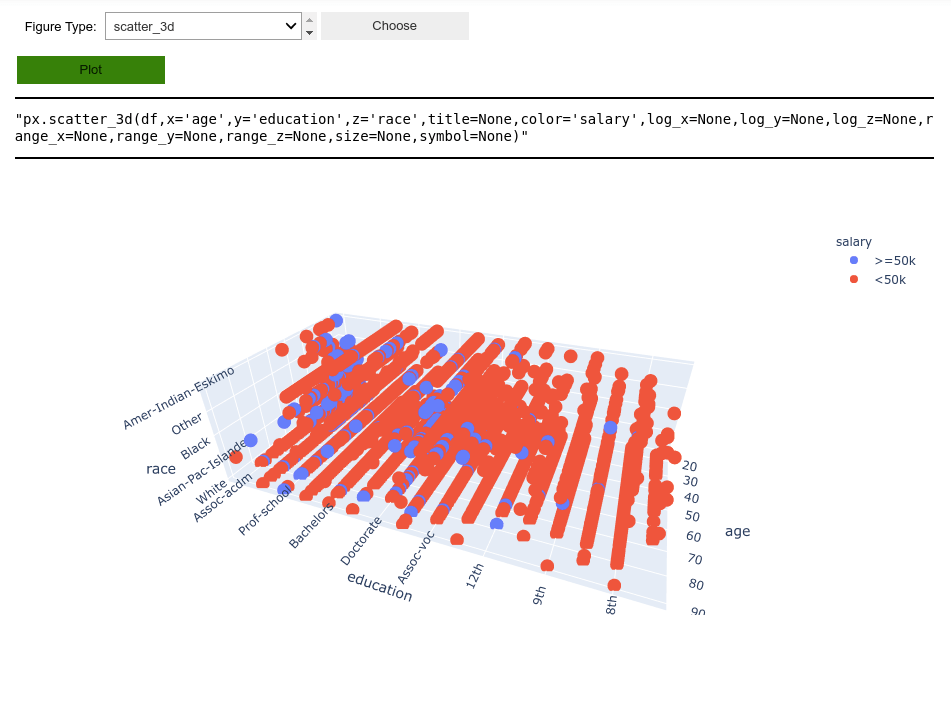
ตัวอย่างหน้าจอพล็อตกราฟ 3 มิติ Scatter 3D เราไม่ต้องจำชื่อ Parameter
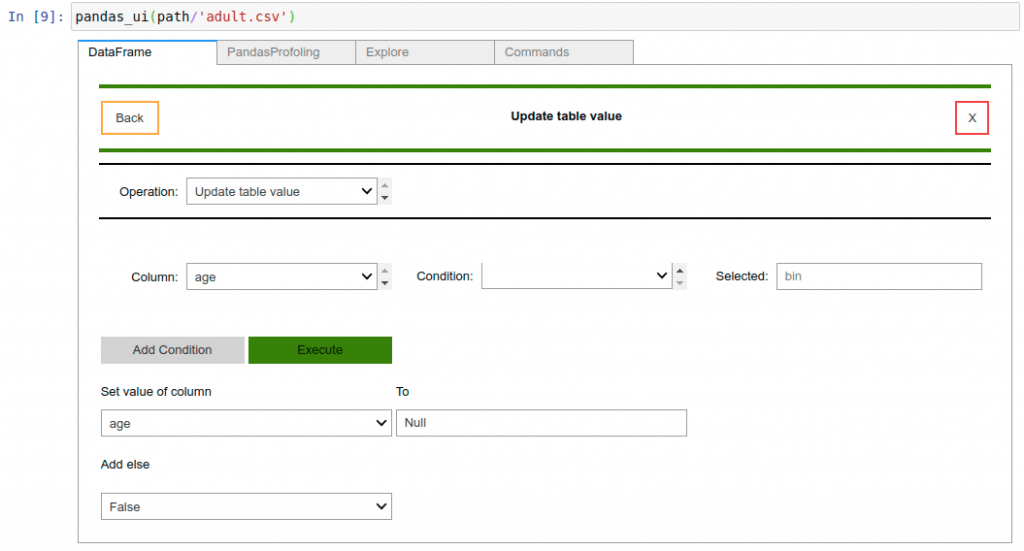
หน้าจอสร้างคำสั่ง Update ข้อมูลทีละเยอะ ๆ ตามเงื่อนไขที่กำหนด
### Credit
*
*
### หมายเหตุ
* Library นี้ใหม่มาก ยังมี Bug อยู่หลายจุด
* ถ้าเกิด Error ให้รัน Cell ใหม่
* ขณะนี้ยังไม่รองรับ [Google Colab](https://www.bualabs.com/archives/1687/what-is-colab-open-jupyter-notebook-in-github-on-google-colab-create-open-in-colab-button-colab-ep-1/)
#### แชร์ให้เพื่อน:
[Facebook](https://www.bualabs.com/#facebook)[Twitter](https://www.bualabs.com/#twitter)[Email](https://www.bualabs.com/#email)[LinkedIn](https://www.bualabs.com/#linkedin)[Line](https://www.bualabs.com/#line)[Share](https://www.addtoany.com/share#url=https%3A%2F%2Fwww.bualabs.com%2Farchives%2F4299%2Fpandas_ui-pandas-dataframe-user-interface-tools-pandas-ep-7%2F\&title=Pandas_UI%20%E0%B9%80%E0%B8%84%E0%B8%A3%E0%B8%B7%E0%B9%88%E0%B8%AD%E0%B8%87%E0%B8%A1%E0%B8%B7%E0%B8%AD%E0%B8%88%E0%B8%B1%E0%B8%94%E0%B8%81%E0%B8%B2%E0%B8%A3%20Pandas%20DataFrame%20%E0%B9%81%E0%B8%9A%E0%B8%9A%E0%B8%87%E0%B9%88%E0%B8%B2%E0%B8%A2%20%E0%B9%86%20%E2%80%93%20Pandas%20ep.7)
#### บทความที่เกี่ยวข้อง:
1. [สำรวจข้อมูล Exploratory Data Analysis (EDA) ด้วย Pandas Profiling วิเคราะห์ Pandas DataFrame – Pandas ep.6](https://www.bualabs.com/archives/2297/exploratory-data-analysis-eda-pandas-profiling-pandas-dataframe-pandas-ep-6/)
2. [จัดการหมวดหมู่เล็ก ๆ ยิบย่อย รวมข้อมูลหมวดหมู่ Category เล็ก ๆ เป็นหมวดหมู่ Other ก่อนป้อนเทรน Machine Learning – Preprocessing ep.4](https://www.bualabs.com/archives/2393/combine-small-category-to-other-category-before-feed-machine-learning-preprocessing-ep-4/)
3. [Customer Segmentation คืออะไร สอนทฤษฎี Machine Learning หลักการ สร้าง Segment Profile กลุ่มลูกค้า, Customer Profile การแบ่งกลุ่มลูกค้า ด้วย K-Means Clustering – Tabular Data ep.4](https://www.bualabs.com/archives/3866/what-is-customer-segmentation-build-segment-profile-target-group-customer-profile-k-means-clustering-tabular-data-ep-4/)
4. [Latent Semantic Analysis (LSA) คืออะไร Text Classification ด้วย Singular Value Decomposition (SVD), Non-negative Matrix Factorization (NMF) – NLP ep.4](https://www.bualabs.com/archives/2971/lsa-latent-semantic-analysis-text-classification-singular-value-decomposition-svd-non-negative-matrix-factorization-nmf-nlp-ep-4/)
Reference :