Automate Your Stock Portfolio
Mar 31 2020
Automate Your Stock Portfolio Research With Python in 6 Minutes
As markets increase in volatility, it’s important to keep a close eye on your investments. Close eye because you may want to sell, but also because you want to be ready in case you want to cost average and double down.
Everyone’s screaming: “buy the dip”, but when is the dip going to happen, and how will that affect your portfolio? Personally, I have been holding onto my shares, and have been looking to repurchase undervalued shares wherever possible. The best way to screen stocks is through following the news and tracking historical performance. This includes trading ratios, and peer comparison, not just stock price tracking.
For a holistic approach to picking stocks, or conducting analysis you want both the income statement and balance sheet on top of market trading statistics. From there, you have everything that you need. With a little bit of knowledge on Python, and JSON, you’ll be able to set up your own automated stock tracker in under 10 minutes. You’ll be pulling balance sheet and income statement items, as well as other key information such as a company’s CEO. Although only a couple of data points are going to be walked through, there are many other data points to explore.

Set-Up
I’ll be introducing you to a very powerful free API for personal investing and learning:
Follow along, and I’ll show you how to pull all sorts of data from this. This data can then be used for further analysis, including data science purposes. Stay tuned for the bottom, where I’ll be posting the final code.
To begin the only two libraries that we’ll be needing:
Share Price
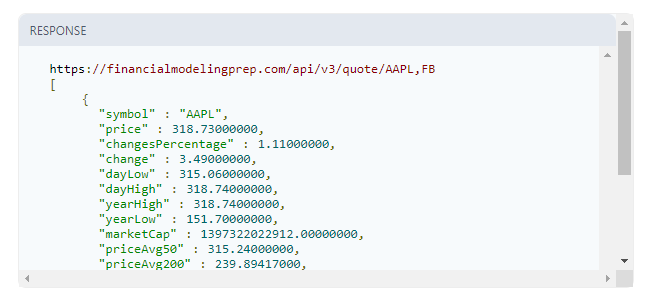
Next, we’ll use a function to pull all of the information from Financial Modeling Prep.
What we are doing, in this case, is we are pulling the stock price from the following URL:Free Stock API and Financial Statements API - FMP APIThis documentation includes a financial statements API, a free stock API and a historical quotes API. Find all…financialmodelingprep.com

The website is broken into different segments, and we used the Quote section above:
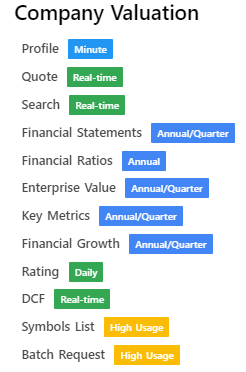
Within the Quote section, we can find the symbol, price, dayLow, dayHigh and other key trading statistics.
Balance Sheet Items
Next, we’ll pull balance sheet items. Within the Financial Statements section of the site, it is broken up into the Balance Sheet, Income Statement, and Cash Flow Statement. Make sure you keep the following code within the getdata(stock) function, mentioned above and keep the indentations.
From here, let’s pull the debt and cash numbers in billions and 2 decimal places.

Income Statement Data
A similar method to pull the quarterly income statement data, we’ll be simplifying the URL to a variable.
Now using the same method as the balance sheet items, we can pull the most recent quarterly revenue for a stock.
Qualitative Company Data
The last example I’ll be showing is pulling qualitative data from the Company Profile section.![]()

The same concepts apply, we first shorten the URL, then we pull the CEO.
With the share price, total cash, total debt, quarterly revenue, and CEO items pulled, we just need to return the data.
So as of now, the code looks like:
Automation and Scale
The last things we need to do now are to fill out our stock tickers and apply the function to all of the tickers.
With the function mapped to the tickers, we can create a DataFrame with pandas to store all of the information for easy data manipulation.
Output
The long-awaited output below:

Although this is useful, I have always been an Excel/CSV kind of guy as most of my work involves excel. To output to excel, use the code below.

For other data points, just adjust the things you are pulling from, and ensure they are from the correct respective URLs.
Further Thoughts
Throughout my investment career, I have found the use of technology in finance to be very important. No longer do we have to resort to manually combing financial statements to find the best data. As an investment banker, when I am working on Mergers & Acquisitions, or debt/equity issuances, I still double check manually, but for my personal portfolio, I currently only use Python.
The reason why Python is sufficient for personal uses is that many investors would not understand the adjustments that finance professional use when they analyze businesses. Although adjustments can be fairly significant, when researching a large number of companies, the last thing you want to do is spend your time working out numerous adjustments for multiple companies.
In investment banking, we adjust numbers for one-time expenditures and other line items. For example, the issue of COVID-19 economic effects on future businesses. To properly view a business, we would normally exclude the effects of COVID on its bottom line. Since this is rare, and a “one-time occurrence”, we argue that it is not a good representation of the underlying business. Because this impact can be seen as a one-time impact, there are normalization techniques to smooth out the income for the past 5 years, when we eventually take into consideration 2020 numbers.
With this analysis, there is no need to go into the nitty-gritty details, and adjustments can be made by either doing it manually or tweaking the code.
It’s always good practice to spot check the numbers that you pull, to make sure that there were no errors in the data mine process. This is just the tip of the iceberg for what you can do with this analysis, and it opens up doors to analysis.
Final Code Below:
Reference : https://medium.com/swlh/automating-your-stock-portfolio-research-with-python-for-beginners-912dc02bf1c2
Last updated