Parse TradingView Stock
Parse TradingView Stock Recommendations in Seconds!
Learn how to parse real-time recommendations for any interval with Python!
In one of my earlier articles, we went over how to parse the top analyst recommendations from Yahoo Finance for any stock. While they offered validation as to where a stock might move in the future, they were only updated once a month and did not offer any info as to the rationale behind the rating.
Luckily, since then, I’ve stumbled upon the wonderful site TradingView. If you aren’t familiar with the site, one of the features they offer is real-time recommendations for as short as 1 minute ahead or for as long as 1 month ahead. These recommendations are purely based on Technical Indicators including Moving Averages, Oscillators, and Pivots and you can see the calculations directly on the page!
So instead of visiting the site each time I wanted a recommendation, I created this simple parser with less than 50 lines of code that can do just that.

Introduction to TradingView
Before I get into the coding aspect, I want to quickly touch upon what and where these recommendations are on TradingView. If you go over to this page, you will see something similar to the image I included below. The page includes key statistics such as Price to Earnings ratio, Earnings Per Share, Market Cap, Dividend information, and much more. You can even click Overview to get a comprehensive table full of ratios as well as an interactive chart, and recent news. However, this isn’t where the recommendations are located.

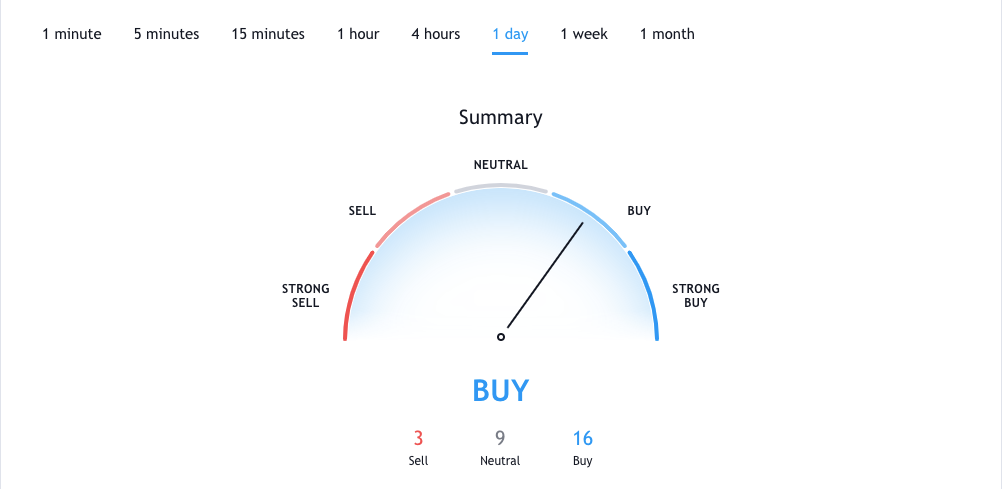
If you continue scrolling down on the Technicals page, there will be multiple charts like the one below, outlining the recommendation and the statistics for the reasoning behind the signal.


The recommendations range from strong buy to strong sell and as you can see in the second image, they are entirely dependent on the technical indicator signals. The algorithm we will be building soon parses the number of buy signals, neutral signals, sell signals, and the overall recommendation. The GitHub gist below contains all the code!
Scraping TradingView Using Python
Setup
In case you do not have Selenium or Pandas installed, you can visit their respective links and download them using pip in your terminal! We will also need a chromedriver (the simulated chrome browser Selenium controls) and to download it using Python you can the webdriver-manager package also found in PyPi.
Additionally, you can use any IDE or Text Editor that supports Python as long as you have the necessary dependencies installed. I personally would recommend downloading either Visual Studio Code or Spyder through Anaconda.
Let’s get into the code
Now that everything should be installed on your machine and you have an idea for what we will be scraping, let’s get into the code!
First, we have to import the dependencies we will need for the rest of the program. In this case, we will need the built-in time module, Pandas, and Selenium.
The time module will allow us to make the program sleep for a number of seconds just so the simulated browser can fully load. Pandas will allow us to create a DataFrame with the data we collect. Finally, we will need selenium so we can create/control a browser window and scrape the JavaScript-rendered information.
Next, we can create two variables, one for the ticker and the other for the interval we are particularly scraping for. The interval can be any of the ones I included in the code fence below.
After we include the imports and parameters, we can set up the chromedriver. The Options class will allow us to add arguments such as headless to customize the simulated browser. Adding headless tells the browser to not pop up each time you run the program. We can set the executable path to the path where you downloaded the chromedriver earlier. In this case, I downloaded it directly into my directory but you do not have to.
We can add our scraping script inside a try/except block to catch errors from breaking our program. First, we must open up the browser using webdriver.get(URL), refresh to load all aspects of the page properly, and then add time.sleep(1) to slow down the program by one second until the browser is completely rendered.
Using the .find_by_class_name method in selenium.webdriver, we can pinpoint the exact portions we want to scrape. For example, only the recommendation has the following class “speedometerSignal-pyzN — tL.” We can retrieve these class names by inspect element in Chrome DevTools. Top open up DevTools, you can right-click on the section you’d like to parse and then press “inspect” to get a similar result to the image below!

We can retrieve the “Buy” using the method .get_attribute(‘innerHTML’) which will store the text that is inside the HTML tag.
Similarly, we can retrieve the number of buy, neutral, and sell signals by finding a class name that is similar between all of them and then using the method .find_elements_by_class_name. Since this time we are calling for elements, not an element, this method will return a list of HTML tags that have the class name we specify.
Lastly, we can append all of the signals to a list, and using the .from_records method, we can turn a tuple of our data and a list of columns into a DataFrame. Finally, we can clean it up by adding a column for the ticker, setting that column as the index, and transposing (rotating) the DataFrame for our final product.

Now within seconds, you should get a similar output to the image above. I hope this algorithm will prove useful to you in the future. Thank you so much for reading!
Disclaimer: The material in this article is purely educational and should not be taken as professional investment advice. Invest at your own discretion.
Reference : https://towardsdatascience.com
Last updated