> For the complete documentation index, see [llms.txt](https://yo-sarawut.gitbook.io/tutorials/llms.txt). Markdown versions of documentation pages are available by appending `.md` to page URLs; this page is available as [Markdown](https://yo-sarawut.gitbook.io/tutorials/tutorials/pandas-1/dataframe.md).
# DataFrame
## Pandas DataFrame
**Pandas DataFrame** is two-dimensional size-mutable, potentially heterogeneous tabular data structure with labeled axes (rows and columns). A Data frame is a two-dimensional data structure, i.e., data is aligned in a tabular fashion in rows and columns. Pandas DataFrame consists of three principal components, the **data**, **rows**, and **columns**.

We will get a brief insight on all these basic operation which can be performed on Pandas DataFrame :
* [Creating a DataFrame](https://www.geeksforgeeks.org/python-pandas-dataframe/#Basics)
* [Dealing with Rows and Columns](https://www.geeksforgeeks.org/python-pandas-dataframe/#Basics1)
* [Indexing and Selecting Data](https://www.geeksforgeeks.org/python-pandas-dataframe/#Basics2)
* [Working with Missing Data](https://www.geeksforgeeks.org/python-pandas-dataframe/#Basics3)
* [Iterating over rows and columns](https://www.geeksforgeeks.org/python-pandas-dataframe/#Basics4)
**Creating a Pandas DataFrame**
In the real world, a Pandas DataFrame will be created by loading the datasets from existing storage, storage can be SQL Database, CSV file, and Excel file. Pandas DataFrame can be created from the lists, dictionary, and from a list of dictionary etc. Dataframe can be created in different ways here are some ways by which we create a dataframe:
[**Creating a dataframe using List**](https://www.geeksforgeeks.org/create-a-pandas-dataframe-from-lists/)**:** DataFrame can be created using a single list or a list of lists.
```python
# import pandas as pd
import pandas as pd
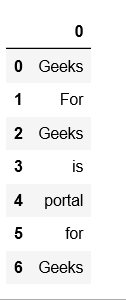
# list of strings
lst = ['Geeks', 'For', 'Geeks', 'is',
'portal', 'for', 'Geeks']
# Calling DataFrame constructor on list
df = pd.DataFrame(lst)
print(df)
```
**Output:**\
\
\
[**Creating DataFrame from dict of ndarray/lists**](https://www.geeksforgeeks.org/python-create-a-pandas-dataframe-from-a-dict-of-equal-length-lists/)**:** To create DataFrame from dict of narray/list, all the narray must be of same length. If index is passed then the length index should be equal to the length of arrays. If no index is passed, then by default, index will be range(n) where n is the array length.
```python
# Python code demonstrate creating
# DataFrame from dict narray / lists
# By default addresses.
import pandas as pd
# intialise data of lists.
data = {'Name':['Tom', 'nick', 'krish', 'jack'],
'Age':[20, 21, 19, 18]}
# Create DataFrame
df = pd.DataFrame(data)
# Print the output.
print(df)
```
**Output:**\

\
For more details refer to [Creating a Pandas DataFrame](https://www.geeksforgeeks.org/creating-a-pandas-dataframe/)\
**Dealing with Rows and Columns**
A Data frame is a two-dimensional data structure, i.e., data is aligned in a tabular fashion in rows and columns. We can perform basic operations on rows/columns like selecting, deleting, adding, and renaming.
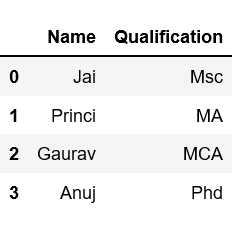
[**Column Selection**](https://www.geeksforgeeks.org/how-to-select-multiple-columns-in-a-pandas-dataframe/)**:** In Order to select a column in Pandas DataFrame, we can either access the columns by calling them by their columns name.
```python
# Import pandas package
import pandas as pd
# Define a dictionary containing employee data
data = {'Name':['Jai', 'Princi', 'Gaurav', 'Anuj'],
'Age':[27, 24, 22, 32],
'Address':['Delhi', 'Kanpur', 'Allahabad', 'Kannauj'],
'Qualification':['Msc', 'MA', 'MCA', 'Phd']}
# Convert the dictionary into DataFrame
df = pd.DataFrame(data)
# select two columns
print(df[['Name', 'Qualification']])
```
**Output:**\
\
\
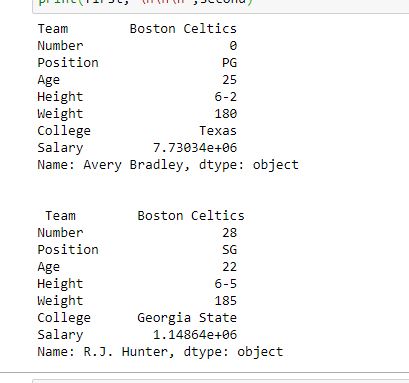
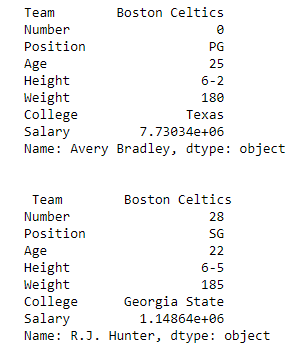
[**Row Selection**](https://www.geeksforgeeks.org/python-pandas-extracting-rows-using-loc/)**:** Pandas provide a unique method to retrieve rows from a Data frame. [`DataFrame.loc[]`](https://www.geeksforgeeks.org/python-pandas-extracting-rows-using-loc/) method is used to retrieve rows from Pandas DataFrame. Rows can also be selected by passing integer location to an [iloc\[\]](https://www.geeksforgeeks.org/python-extracting-rows-using-pandas-iloc/) function.\
\
**Note:** We’ll be using [`nba.csv`](https://media.geeksforgeeks.org/wp-content/uploads/nba.csv) file in below examples.
```python
# importing pandas package
import pandas as pd
# making data frame from csv file
data = pd.read_csv("nba.csv", index_col ="Name")
# retrieving row by loc method
first = data.loc["Avery Bradley"]
second = data.loc["R.J. Hunter"]
print(first, "\n\n\n", second)
```
**Output:**\
As shown in the output image, two series were returned since there was only one parameter both of the times.\
\
For more Details refer to [Dealing with Rows and Columns](https://www.geeksforgeeks.org/dealing-with-rows-and-columns-in-pandas-dataframe/)\
**Indexing and Selecting Data**
Indexing in pandas means simply selecting particular rows and columns of data from a DataFrame. Indexing could mean selecting all the rows and some of the columns, some of the rows and all of the columns, or some of each of the rows and columns. Indexing can also be known as **Subset Selection**.
**Indexing a Dataframe using indexing operator `[]` :**\
Indexing operator is used to refer to the square brackets following an object. The [`.loc`](https://www.geeksforgeeks.org/python-pandas-extracting-rows-using-loc/) and [`.iloc`](https://www.geeksforgeeks.org/python-extracting-rows-using-pandas-iloc/) indexers also use the indexing operator to make selections. In this indexing operator to refer to df\[].
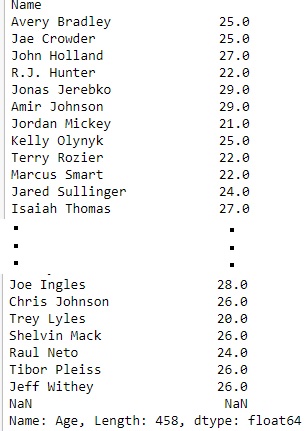
**Selecting a single columns**
In order to select a single column, we simply put the name of the column in-between the brackets
```python
# importing pandas package
import pandas as pd
# making data frame from csv file
data = pd.read_csv("nba.csv", index_col ="Name")
# retrieving columns by indexing operator
first = data["Age"]
print(first)
```
**Output:**\
\
\
**Indexing a DataFrame using** [**`.loc[ ]`**](https://www.geeksforgeeks.org/python-pandas-extracting-rows-using-loc/) **:**\
This function selects data by the **label** of the rows and columns. The `df.loc` indexer selects data in a different way than just the indexing operator. It can select subsets of rows or columns. It can also simultaneously select subsets of rows and columns.
**Selecting a single row**
In order to select a single row using `.loc[]`, we put a single row label in a `.loc` function.
```python
# importing pandas package
import pandas as pd
# making data frame from csv file
data = pd.read_csv("nba.csv", index_col ="Name")
# retrieving row by loc method
first = data.loc["Avery Bradley"]
second = data.loc["R.J. Hunter"]
print(first, "\n\n\n", second)
```
**Output:**\
As shown in the output image, two series were returned since there was only one parameter both of the times.\
\
\
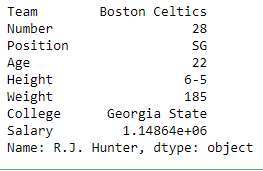
**Indexing a DataFrame using** [**`.iloc[ ]`**](https://www.geeksforgeeks.org/python-extracting-rows-using-pandas-iloc/) **:**\
This function allows us to retrieve rows and columns by position. In order to do that, we’ll need to specify the positions of the rows that we want, and the positions of the columns that we want as well. The `df.iloc` indexer is very similar to `df.loc` but only uses integer locations to make its selections.\
**Selecting a single row**
In order to select a single row using `.iloc[]`, we can pass a single integer to `.iloc[]` function.
```python
import pandas as pd
# making data frame from csv file
data = pd.read_csv("nba.csv", index_col ="Name")
# retrieving rows by iloc method
row2 = data.iloc[3]
print(row2)
```
**Output:**\
\
\
For more Details refer
* [Indexing and Selecting Data with Pandas](https://www.geeksforgeeks.org/indexing-and-selecting-data-with-pandas/)
* [Boolean Indexing in Pandas](https://www.geeksforgeeks.org/boolean-indexing-in-pandas/)
**Working with Missing Data**
Missing Data can occur when no information is provided for one or more items or for a whole unit. Missing Data is a very big problem in real life scenario. Missing Data can also refer to as NA(Not Available) values in pandas.
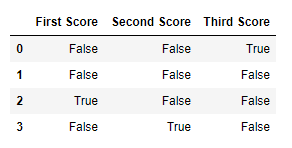
**Checking for missing values using `isnull()` and `notnull() :`**\
In order to check missing values in Pandas DataFrame, we use a function `isnull()` and `notnull()`. Both function help in checking whether a value is `NaN` or not. These function can also be used in Pandas Series in order to find null values in a series.
```python
# importing pandas as pd
import pandas as pd
# importing numpy as np
import numpy as np
# dictionary of lists
dict = {'First Score':[100, 90, np.nan, 95],
'Second Score': [30, 45, 56, np.nan],
'Third Score':[np.nan, 40, 80, 98]}
# creating a dataframe from list
df = pd.DataFrame(dict)
# using isnull() function
df.isnull()
```
**Output:**\
\
\
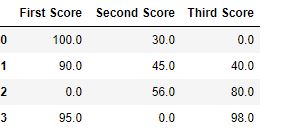
**Filling missing values using `fillna()`, `replace()` and `interpolate() :`**\
In order to fill null values in a datasets, we use `fillna()`, `replace()` and `interpolate()` function these function replace NaN values with some value of their own. All these function help in filling a null values in datasets of a DataFrame. Interpolate() function is basically used to fill `NA` values in the dataframe but it uses various interpolation technique to fill the missing values rather than hard-coding the value.
```python
# importing pandas as pd
import pandas as pd
# importing numpy as np
import numpy as np
# dictionary of lists
dict = {'First Score':[100, 90, np.nan, 95],
'Second Score': [30, 45, 56, np.nan],
'Third Score':[np.nan, 40, 80, 98]}
# creating a dataframe from dictionary
df = pd.DataFrame(dict)
# filling missing value using fillna()
df.fillna(0)
```
**Output:**\
\
\
**Dropping missing values using `dropna()` :**\
In order to drop a null values from a dataframe, we used `dropna()` function this fuction drop Rows/Columns of datasets with Null values in different ways.
```python
# importing pandas as pd
import pandas as pd
# importing numpy as np
import numpy as np
# dictionary of lists
dict = {'First Score':[100, 90, np.nan, 95],
'Second Score': [30, np.nan, 45, 56],
'Third Score':[52, 40, 80, 98],
'Fourth Score':[np.nan, np.nan, np.nan, 65]}
# creating a dataframe from dictionary
df = pd.DataFrame(dict)
df
```
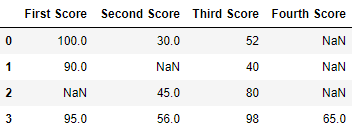\
Now we drop rows with at least one Nan value (Null value)
```python
# importing pandas as pd
import pandas as pd
# importing numpy as np
import numpy as np
# dictionary of lists
dict = {'First Score':[100, 90, np.nan, 95],
'Second Score': [30, np.nan, 45, 56],
'Third Score':[52, 40, 80, 98],
'Fourth Score':[np.nan, np.nan, np.nan, 65]}
# creating a dataframe from dictionary
df = pd.DataFrame(dict)
# using dropna() function
df.dropna()
```
**Output:**\
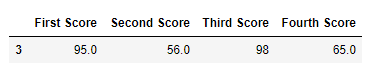\
For more Details refer to [Working with Missing Data in Pandas](https://www.geeksforgeeks.org/working-with-missing-data-in-pandas/)\
**Iterating over rows and columns**
Iteration is a general term for taking each item of something, one after another. Pandas DataFrame consists of rows and columns so, in order to iterate over dataframe, we have to iterate a dataframe like a dictionary.\
**Iterating over rows :**\
In order to iterate over rows, we can use three function `iteritems()`, `iterrows()`, `itertuples()` . These three function will help in iteration over rows.
```python
# importing pandas as pd
import pandas as pd
# dictionary of lists
dict = {'name':["aparna", "pankaj", "sudhir", "Geeku"],
'degree': ["MBA", "BCA", "M.Tech", "MBA"],
'score':[90, 40, 80, 98]}
# creating a dataframe from a dictionary
df = pd.DataFrame(dict)
print(df)
```
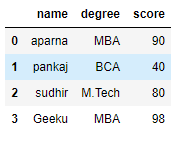\
Now we apply `iterrows()` function in order to get a each element of rows.
```python
# importing pandas as pd
import pandas as pd
# dictionary of lists
dict = {'name':["aparna", "pankaj", "sudhir", "Geeku"],
'degree': ["MBA", "BCA", "M.Tech", "MBA"],
'score':[90, 40, 80, 98]}
# creating a dataframe from a dictionary
df = pd.DataFrame(dict)
# iterating over rows using iterrows() function
for i, j in df.iterrows():
print(i, j)
print()
```
Run on IDE
**Output:**\
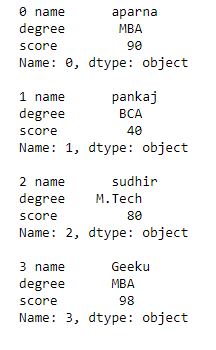\
\
**Iterating over Columns :**\
In order to iterate over columns, we need to create a list of dataframe columns and then iterating through that list to pull out the dataframe columns.
```python
# importing pandas as pd
import pandas as pd
# dictionary of lists
dict = {'name':["aparna", "pankaj", "sudhir", "Geeku"],
'degree': ["MBA", "BCA", "M.Tech", "MBA"],
'score':[90, 40, 80, 98]}
# creating a dataframe from a dictionary
df = pd.DataFrame(dict)
print(df)
```
Run on IDE
\
Now we iterate through columns in order to iterate through columns we first create a list of dataframe columns and then iterate through list.
```python
# creating a list of dataframe columns
columns = list(df)
for i in columns:
# printing the third element of the column
print (df[i][2])
```
**Output:**\
\
\
For more Details refer to [Iterating over rows and columns in Pandas DataFrame](https://www.geeksforgeeks.org/iterating-over-rows-and-columns-in-pandas-dataframe/)
**DataFrame Methods:**
| FUNCTION | DESCRIPTION |
| -------------------------------------------------------------------------------------------------------------------------------------------------------------------------------------------------- | -------------------------------------------------------------------------------------------------------------------------------------------------------------------------------------------------------------------------------- |
| **index()** | Method returns index (row labels) of the DataFrame |
| [**insert()**](https://www.geeksforgeeks.org/python-pandas-dataframe-insert/) | Method inserts a column into a DataFrame |
| [**add()**](https://www.geeksforgeeks.org/python-pandas-dataframe-add/) | Method returns addition of dataframe and other, element-wise (binary operator add) |
| [**sub()**](https://www.geeksforgeeks.org/python-pandas-dataframe-sub/) | Method returns subtraction of dataframe and other, element-wise (binary operator sub) |
| [**mul()**](https://www.geeksforgeeks.org/python-pandas-dataframe-mul/) | Method returns multiplication of dataframe and other, element-wise (binary operator mul) |
| [**div()**](https://www.geeksforgeeks.org/python-pandas-dataframe-div/) | Method returns floating division of dataframe and other, element-wise (binary operator truediv) |
| **unique()** | Method extracts the unique values in the dataframe |
| [**nunique()**](https://www.geeksforgeeks.org/python-pandas-dataframe-nunique/) | Method returns count of the unique values in the dataframe |
| **value\_counts()** | Method counts the number of times each unique value occurs within the Series |
| **columns()** | Method returns the column labels of the DataFrame |
| **axes()** | Method returns a list representing the axes of the DataFrame |
| [**isnull()**](https://www.geeksforgeeks.org/python-pandas-isnull-and-notnull/) | Method creates a Boolean Series for extracting rows with null values |
| [**notnull()**](https://www.geeksforgeeks.org/python-pandas-isnull-and-notnull/) | Method creates a Boolean Series for extracting rows with non-null values |
| **between()** | Method extracts rows where a column value falls in between a predefined range |
| [**isin()**](https://www.geeksforgeeks.org/python-pandas-dataframe-isin/) | Method extracts rows from a DataFrame where a column value exists in a predefined collection |
| **dtypes()** | Method returns a Series with the data type of each column. The result’s index is the original DataFrame’s columns |
| [**astype()**](https://www.geeksforgeeks.org/python-pandas-dataframe-astype/) | Method converts the data types in a Series |
| **values()** | Method returns a Numpy representation of the DataFrame i.e. only the values in the DataFrame will be returned, the axes labels will be removed |
| **sort\_values()-** [**Set1**](https://www.geeksforgeeks.org/python-pandas-dataframe-sort_values-set-1/)**,** [**Set2**](https://www.geeksforgeeks.org/python-pandas-dataframe-sort_values-set-2/) | Method sorts a data frame in Ascending or Descending order of passed Column |
| [**sort\_index()**](https://www.geeksforgeeks.org/python-pandas-dataframe-sort_index/) | Method sorts the values in a DataFrame based on their index positions or labels instead of their values but sometimes a data frame is made out of two or more data frames and hence later index can be changed using this method |
| [**loc\[\]**](https://www.geeksforgeeks.org/python-pandas-extracting-rows-using-loc/) | Method retrieves rows based on index label |
| [**iloc\[\]**](https://www.geeksforgeeks.org/python-extracting-rows-using-pandas-iloc/) | Method retrieves rows based on index position |
| [**ix\[\]**](https://www.geeksforgeeks.org/python-pandas-dataframe-ix/) | Method retrieves DataFrame rows based on either index label or index position. This method combines the best features of the .loc\[] and .iloc\[] methods |
| [**rename()**](https://www.geeksforgeeks.org/python-pandas-dataframe-rename/) | Method is called on a DataFrame to change the names of the index labels or column names |
| **columns()** | Method is an alternative attribute to change the coloumn name |
| [**drop()**](https://www.geeksforgeeks.org/python-delete-rows-columns-from-dataframe-using-pandas-drop/) | Method is used to delete rows or columns from a DataFrame |
| [**pop()**](https://www.geeksforgeeks.org/python-pandas-dataframe-pop/) | Method is used to delete rows or columns from a DataFrame |
| [**sample()**](https://www.geeksforgeeks.org/python-pandas-dataframe-sample/) | Method pulls out a random sample of rows or columns from a DataFrame |
| [**nsmallest()**](https://www.geeksforgeeks.org/python-pandas-dataframe-nsmallest/) | Method pulls out the rows with the smallest values in a column |
| [**nlargest()**](https://www.geeksforgeeks.org/python-pandas-dataframe-nlargest/) | Method pulls out the rows with the largest values in a column |
| [**shape()**](https://www.geeksforgeeks.org/python-pandas-df-size-df-shape-and-df-ndim/) | Method returns a tuple representing the dimensionality of the DataFrame |
| [**ndim()**](https://www.geeksforgeeks.org/python-pandas-df-size-df-shape-and-df-ndim/) | Method returns an ‘int’ representing the number of axes / array dimensions.
Returns 1 if Series, otherwise returns 2 if DataFrame
|
| [**dropna()**](https://www.geeksforgeeks.org/python-pandas-dataframe-dropna/) | Method allows the user to analyze and drop Rows/Columns with Null values in different ways |
| [**fillna()**](https://www.geeksforgeeks.org/python-pandas-dataframe-fillna-to-replace-null-values-in-dataframe/) | Method manages and let the user replace NaN values with some value of their own |
| [**rank()**](https://www.geeksforgeeks.org/python-pandas-dataframe-rank/) | Values in a Series can be ranked in order with this method |
| [**query()**](https://www.geeksforgeeks.org/python-filtering-data-with-pandas-query-method/) | Method is an alternate string-based syntax for extracting a subset from a DataFrame |
| [**copy()**](https://www.geeksforgeeks.org/python-difference-between-pandas-copy-and-copying-through-variables/) | Method creates an independent copy of a pandas object |
| [**duplicated()**](https://www.geeksforgeeks.org/python-pandas-dataframe-duplicated/) | Method creates a Boolean Series and uses it to extract rows that have duplicate values |
| [**drop\_duplicates()**](https://www.geeksforgeeks.org/python-pandas-dataframe-drop_duplicates/) | Method is an alternative option to identifying duplicate rows and removing them through filtering |
| [**set\_index()**](https://www.geeksforgeeks.org/python-pandas-dataframe-set_index/) | Method sets the DataFrame index (row labels) using one or more existing columns |
| [**reset\_index()**](https://www.geeksforgeeks.org/python-pandas-dataframe-reset_index/) | Method resets index of a Data Frame. This method sets a list of integer ranging from 0 to length of data as index |
| [**where()**](https://www.geeksforgeeks.org/python-pandas-dataframe-where/) | Method is used to check a Data Frame for one or more condition and return the result accordingly. By default, the rows not satisfying the condition are filled with NaN value |
\
**More on Pandas**
1. [Python | Pandas Series](https://www.geeksforgeeks.org/python-pandas-series/)
2. [Python | Pandas Working With Text Data](https://www.geeksforgeeks.org/python-pandas-working-with-text-data/)
3. [Python | Pandas Working with Dates and Times](https://www.geeksforgeeks.org/python-pandas-working-with-dates-and-times/)
4. [Python | Pandas Merging, Joining, and Concatenating](https://www.geeksforgeeks.org/python-pandas-merging-joining-and-concatenating/)
Reference :