> For the complete documentation index, see [llms.txt](https://yo-sarawut.gitbook.io/tutorials/llms.txt). Markdown versions of documentation pages are available by appending `.md` to page URLs; this page is available as [Markdown](https://yo-sarawut.gitbook.io/tutorials/articles/python-1/image-handling-and-processing/image-processing-with-numpy.md).
# Image Processing with Numpy
I recently had to computationally alter some images, an ended up getting interested in some of the basic image manipulation techniques. The result is this post.
In python, there are a number of powerful libraries that make image processing easy, such as [OpenCV](http://docs.opencv.org/3.0-beta/doc/py_tutorials/py_tutorials.html), [SciKit-Image](http://scikit-image.org/) and [Pillow](http://python-pillow.org/). For anyone thinking about doing serious image processing, they should be the first place to look.
However, I am not planning on putting anything into production. Instead the goal of this post is to try and understand the fundamentals of a few simple image processing techniques. Because of this, I am going to stick to using numpy to preform most of the manipulations, although I will use other libraries now and then.
Let's start by loading our librariesIn \[1]:
```python
import numpy as np
import matplotlib.pylab as plt
%matplotlib inline
```
And loading our imageIn \[2]:
```
im = plt.imread("BTD.jpg")
im.shape
```
Out\[2]:
```
(4608, 2592, 3)
```
We see that image is loaded into an array of dimension 4608 x 2592 x 3.
The first two indices represent the Y and X position of a pixel, and the third represents the RGB colour value of the pixel. Let's take a look at what the image is ofIn \[3]:
```
def plti(im, h=8, **kwargs):
"""
Helper function to plot an image.
"""
y = im.shape[0]
x = im.shape[1]
w = (y/x) * h
plt.figure(figsize=(w,h))
plt.imshow(im, interpolation="none", **kwargs)
plt.axis('off')
plti(im)
```

It is a photo of a painting of a dog. The painting itself was found in a flat in London I lived in may years ago, abandoned by its previous owner. I don't know what the story behind it is. If you do, please get in touch.
We can see that whichever bumbling fool took that photo of the painting also captured a lot of the wall. We can crop the photo so we are only focused on the painting itself. In numpy, this is just a matter of slicing the image arrayIn \[4]:
```
im = im[400:3800,:2000,:]
plti(im)
```

## Colours
Each pixel of the image is represented by three integers: the RGB value of its colour. Splitting the image into seperate colour components is just a matter of pulling out the correct slice of the image array:In \[6]:
```
fig, axs = plt.subplots(nrows=1, ncols=3, figsize=(15,5))
for c, ax in zip(range(3), axs):
tmp_im = np.zeros(im.shape, dtype="uint8")
tmp_im[:,:,c] = im[:,:,c]
ax.imshow(tmp_im)
ax.set_axis_off()
```

When using matplotlib's [imshow](http://matplotlib.org/api/axes_api.html#matplotlib.axes.Axes.imshow) to display images, it is important to keep track of which data type you are using, as the colour mapping used is data type dependent: if a float is used, the values are mapped to the range 0-1, so we need to cast to type "uint8" to get the expected behavior. A good discussion of this issue can be found here [here](http://stackoverflow.com/questions/24739769/matplotlib-imshow-plots-different-if-using-colormap-or-rgb-array).
In my first edition of this post I made this mistake. Thanks to commenter Rusty Chris Holleman for pointing out the problem.
### Colour Transformations
Representing colour in this way, we can think of each pixel as a point in a three dimensional space. Thinking of colour this way, we can apply various transformations to the colour "point". An interesting example of these is "rotating" the colour.
There is some subtleties - a legal colours officially exist as integer points in a three dimensional cube of side lengths 255. It is possible that a rotation could push a point out of this cube. To get around this I apply a [sigmoid](https://en.wikipedia.org/wiki/Sigmoid_function) transformation to the data, a mapping from the range 0-1 to the full real line. Having applied this transformation we apply the rotation matrix then transform back to colour space.
The rotation matrix is applied pixel-wise to to the image using numpy's [Einstein notation](https://en.wikipedia.org/wiki/Einstein_notation) function, which I hadn't used before but, but make the operation concise. It is explained well in [this post](https://obilaniu6266h16.wordpress.com/2016/02/04/einstein-summation-in-numpy/).
The following functions apply a sigmoid to the images colour space, and rotate it about the red axis by some angle, before returning the image to normal colour space.In \[7]:
```
def do_normalise(im):
return -np.log(1/((1 + im)/257) - 1)
def undo_normalise(im):
return (1 + 1/(np.exp(-im) + 1) * 257).astype("uint8")
def rotation_matrix(theta):
"""
3D rotation matrix around the X-axis by angle theta
"""
return np.c_[
[1,0,0],
[0,np.cos(theta),-np.sin(theta)],
[0,np.sin(theta),np.cos(theta)]
]
im_normed = do_normalise(im)
im_rotated = np.einsum("ijk,lk->ijl", im_normed, rotation_matrix(np.pi))
im2 = undo_normalise(im_rotated)
plti(im2)
```

Not bad. It looks even more impressive if we continiously rotate the colour of the pixels. We can animate this transformation using matplotlib's [FuncAnimation](http://matplotlib.org/api/animation_api.html) tool. [This post](https://jakevdp.github.io/blog/2012/08/18/matplotlib-animation-tutorial/) has an excellent introduction to how to use it.In \[8]:
```
from matplotlib.animation import FuncAnimation
fig, ax = plt.subplots(figsize=(5,8))
def update(i):
im_normed = do_normalise(im)
im_rotated = np.einsum("ijk,lk->ijl", im_normed, rotation_matrix(i * np.pi/10))
im2 = undo_normalise(im_rotated)
ax.imshow(im2)
ax.set_title("Angle: {}*pi/10".format(i), fontsize=20)
ax.set_axis_off()
anim = FuncAnimation(fig, update, frames=np.arange(0, 20), interval=50)
anim.save('colour_rotation.gif', dpi=80, writer='imagemagick')
plt.close()
#  ```
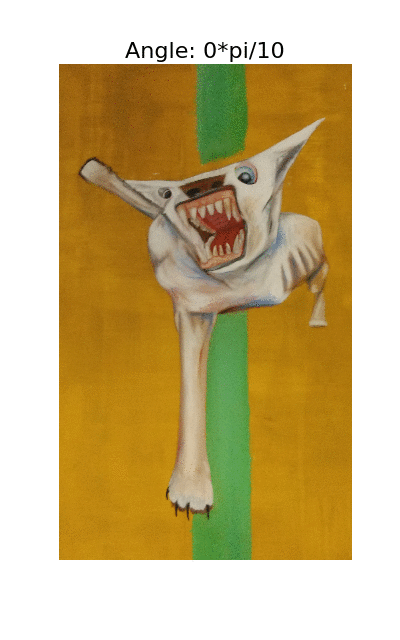
psychedelic.
## To Greyscale
On the topic of colour, we can also transform the image to greyscale easily. There are a number of ways to do this, but a straight forward way is to take the weighted mean of the RGB value of original image:In \[9]:
```
def to_grayscale(im, weights = np.c_[0.2989, 0.5870, 0.1140]):
"""
Transforms a colour image to a greyscale image by
taking the mean of the RGB values, weighted
by the matrix weights
"""
tile = np.tile(weights, reps=(im.shape[0],im.shape[1],1))
return np.sum(tile * im, axis=2)
```
In \[10]:
```
img = to_grayscale(im)
plti(img, cmap='Greys')
```

## Convoluted
Another of the basic operations you can apply to an image is a convolution. It is defined as
C(x,y)=∫dx′dy′I(x+x′,y+y′)W(x′,y′)C(x,y)=∫dx′dy′I(x+x′,y+y′)W(x′,y′)
Where CC is the convoluted image, II is the original image and WW is a window function. Essentially we are replacing each pixel with a weighted sum of nearby pixels.
Because convolutions can be expensive, let's start by shrinking the imageIn \[11]:
```
from scipy.ndimage.interpolation import zoom
im_small = zoom(im, (0.2,0.2,1))
```
We can now apply a uniform window to the image. This has the effect of bluring the image, by averaging each pixel with those nearbyIn \[12]:
```
from scipy.signal import convolve2d
def convolve_all_colours(im, window):
"""
Convolves im with window, over all three colour channels
"""
ims = []
for d in range(3):
im_conv_d = convolve2d(im[:,:,d], window, mode="same", boundary="symm")
ims.append(im_conv_d)
im_conv = np.stack(ims, axis=2).astype("uint8")
return im_conv
n=50
window = np.ones((n,n))
window /= np.sum(window)
plti(convolve_all_colours(im_small, window))
```

For blurring an image, there is a whole host of different windows and functions that can be used. The most common I have found are the uniform window, the Gaussian window and the median filter. To get a feel what these are doing to an image, I apply all of these filters to our image, for different window sizesIn \[13]:
```
from scipy.ndimage import median_filter
def make_gaussian_window(n, sigma=1):
"""
Creates a square window of size n by n of weights from a gaussian
of width sigma.
"""
nn = int((n-1)/2)
a = np.asarray([[x**2 + y**2 for x in range(-nn,nn+1)] for y in range(-nn,nn+1)])
return np.exp(-a/(2*sigma**2))
def median_filter_all_colours(im_small, window_size):
"""
Applies a median filer to all colour channels
"""
ims = []
for d in range(3):
im_conv_d = median_filter(im_small[:,:,d], size=(window_size,window_size))
ims.append(im_conv_d)
im_conv = np.stack(ims, axis=2).astype("uint8")
return im_conv
window_sizes = [9,17,33,65]
fig, axs = plt.subplots(nrows=3, ncols=len(window_sizes), figsize=(15,15));
# mean filter
for w, ax in zip(window_sizes, axs[0]):
window = np.ones((w,w))
window /= np.sum(window)
ax.imshow(convolve_all_colours(im_small, window));
ax.set_title("Mean Filter: window size: {}".format(w));
ax.set_axis_off();
# gaussian filter
for w, ax in zip(window_sizes, axs[1]):
window = make_gaussian_window(w,sigma=w)
window /= np.sum(window)
ax.imshow(convolve_all_colours(im_small, window));
ax.set_title("Gaussian Filter: window size: {}".format(w));
ax.set_axis_off();
# median filter
for w, ax in zip(window_sizes, axs[2]):
ax.imshow(median_filter_all_colours(im_small, w));
ax.set_title("Median Filter: window size: {}".format(w));
ax.set_axis_off();
```

Blurring is only one use of convolutions in image processing. By using more exotic windows, was can extract different kinds of information. The [Sobel filter](https://www.degeneratestate.org/posts/2016/Oct/23/image-processing-with-numpy/) tried to approximate the gradients of the image along one direction using window functions of the form
```
[[-1,0,1],
[-2,0,2],
[-1,0,1]]
```
By finding the gradient in both the X and Y directions, and then taking the magnitude of these values we get a map of the gradients in an image for each colourIn \[14]:
```
%%time
n=100
sobel_x = np.c_[
[-1,0,1],
[-2,0,2],
[-1,0,1]
]
sobel_y = np.c_[
[1,2,1],
[0,0,0],
[-1,-2,-1]
]
ims = []
for d in range(3):
sx = convolve2d(im_small[:,:,d], sobel_x, mode="same", boundary="symm")
sy = convolve2d(im_small[:,:,d], sobel_y, mode="same", boundary="symm")
ims.append(np.sqrt(sx*sx + sy*sy))
im_conv = np.stack(ims, axis=2).astype("uint8")
plti(im_conv)
```
```
CPU times: user 184 ms, sys: 0 ns, total: 184 ms
Wall time: 182 ms
```

The results are pretty impressive. By combining filtering and gradient finding operations together we can generate some strange patterns that resemble the original image but are distorted in interesting ways. The best I have found so far is combining a large window median filter with a Sobel filterIn \[15]:
```
im_smoothed = median_filter_all_colours(im_small, 71)
sobel_x = np.c_[
[-1,0,1],
[-2,0,2],
[-1,0,1]
]
sobel_y = np.c_[
[1,2,1],
[0,0,0],
[-1,-2,-1]
]
ims = []
for d in range(3):
sx = convolve2d(im_smoothed[:,:,d], sobel_x, mode="same", boundary="symm")
sy = convolve2d(im_smoothed[:,:,d], sobel_y, mode="same", boundary="symm")
ims.append(np.sqrt(sx*sx + sy*sy))
im_conv = np.stack(ims, axis=2).astype("uint8")
plti(im_conv)
```

So far we've looked at applying the same operations to all colour channels at once. If we blur only one colour channel at a time, we get the following eerie effectsIn \[16]:
```
fig, axs = plt.subplots(nrows=1, ncols=4, figsize=(15,5))
ax= axs[0]
ax.imshow(im_small)
ax.set_title("Original", fontsize=20)
ax.set_axis_off()
w=75
window = np.ones((w,w))
window /= np.sum(window)
ax= axs[1]
ims = []
for d in range(3):
if d == 0:
im_conv_d = convolve2d(im_small[:,:,d],window, mode="same", boundary="symm")
else:
im_conv_d = im_small[:,:,d]
ims.append(im_conv_d)
ax.imshow(np.stack(ims, axis=2).astype("uint8"))
ax.set_title("Red Blur", fontsize=20)
ax.set_axis_off()
ax= axs[2]
ims = []
for d in range(3):
if d == 1:
im_conv_d = convolve2d(im_small[:,:,d], window, mode="same", boundary="symm")
else:
im_conv_d = im_small[:,:,d]
ims.append(im_conv_d)
ax.imshow(np.stack(ims, axis=2).astype("uint8"))
ax.set_title("Blue Blur", fontsize=20)
ax.set_axis_off()
ax= axs[3]
ims = []
for d in range(3):
if d == 2:
im_conv_d = convolve2d(im_small[:,:,d], window, mode="same", boundary="symm")
else:
im_conv_d = im_small[:,:,d]
ims.append(im_conv_d)
ax.imshow(np.stack(ims, axis=2).astype("uint8"))
ax.set_title("Green Blur", fontsize=20)
ax.set_axis_off()
```

## Segmentation
Another major area of image processing is segmenting the image into different regions, for example foreground and background. There are a number of ways to do this, and I will only look at a few here.
The simplest is to convert the image to greyscale, and find a threshold. Pixels with a value above the threshold are treated as belonging to one region, and below another region. We can explore how different choosing different thresholds segments our greyscale image belowIn \[16]:
```
def simple_threshold(im, threshold=128):
return ((im > threshold) * 255).astype("uint8")
thresholds = [100,120,128,138,150]
fig, axs = plt.subplots(nrows=1, ncols=len(thresholds), figsize=(20,5));
gray_im = to_grayscale(im)
for t, ax in zip(thresholds, axs):
ax.imshow(simple_threshold(gray_im, t), cmap='Greys');
ax.set_title("Threshold: {}".format(t), fontsize=20);
ax.set_axis_off();
```

How exactly we choose a threshold is going to be application specific. However, we might argue that we would expect the backgroud pixel values to be similar in value to other background pixel values, and the same for the foreground. One way to quantify this is to say that we are looking for the threshold which minimises the inter pixel variance in the foreground and background. One way to calculate this is [Otsu threshold algorithm](https://www.degeneratestate.org/posts/2016/Oct/23/image-processing-with-numpy/), implemented belowIn \[17]:
```
def otsu_threshold(im):
pixel_counts = [np.sum(im == i) for i in range(256)]
s_max = (0,-10)
ss = []
for threshold in range(256):
# update
w_0 = sum(pixel_counts[:threshold])
w_1 = sum(pixel_counts[threshold:])
mu_0 = sum([i * pixel_counts[i] for i in range(0,threshold)]) / w_0 if w_0 > 0 else 0
mu_1 = sum([i * pixel_counts[i] for i in range(threshold, 256)]) / w_1 if w_1 > 0 else 0
# calculate
s = w_0 * w_1 * (mu_0 - mu_1) ** 2
ss.append(s)
if s > s_max[1]:
s_max = (threshold, s)
return s_max[0]
t = otsu_threshold(gray_im)
plti(simple_threshold(gray_im, t), cmap='Greys')
```

It's not great. However, we might think that by converting our image to greyscale we are throwing away information. We can apply the same process to each colour channel separately to getIn \[18]:
```
fig, axs = plt.subplots(nrows=1, ncols=3, figsize=(15,5))
c_ims = []
for c, ax in zip(range(3), axs):
tmp_im = im[:,:,c]
t = otsu_threshold(tmp_im)
tmp_im = simple_threshold(tmp_im, t)
ax.imshow(tmp_im, cmap='Greys')
c_ims.append(tmp_im)
ax.set_axis_off()
```

A natural way to combine each channel into one image is to take the intersection of each thresholded colour channelIn \[19]:
```
plti(c_ims[0] & c_ims[1] & c_ims[2], cmap='Greys')
```

Which works much better then just looking at the greyscale image.
We can be more direct in our approach though. In Otsu thresholding, we found the threshold which minimised the inter-segment pixel variance. If rather then looking for a threshold, we look for clusters in colour space, we end up with the [K-means](https://en.wikipedia.org/wiki/K-means_clustering) clustering technique. Applying this directed to the coloured image, we getIn \[20]:
```
from sklearn.cluster import KMeans
h,w = im_small.shape[:2]
im_small_long = im_small.reshape((h * w, 3))
im_small_wide = im_small_long.reshape((h,w,3))
km = KMeans(n_clusters=3)
km.fit(im_small_long)
cc = km.cluster_centers_.astype(np.uint8)
out = np.asarray([cc[i] for i in km.labels_]).reshape((h,w,3))
plti(out)
```

Which isn't bad at all. By randomly assigning colours to each of the segments we can create artIn \[21]:
```
rng = range(4)
fig, axs = plt.subplots(nrows=1, ncols=len(rng), figsize=(15,5))
gray_im = to_grayscale(im)
for t, ax in zip(rng, axs):
rnd_cc = np.random.randint(0,256, size = (3,3))
out = np.asarray([rnd_cc[i] for i in km.labels_]).reshape((h,w,3))
ax.imshow(out)
ax.set_axis_off()
```

## Vectorization
So far we have treated an image as a bitmap. As a final step, I am going to extract the segment of the dog from the image, and convert it into a vectorise image.
Let's start by grabbing the segment of the dog:In \[23]:
```
dog = np.asarray([cc[i] if i == 1 else [0,0,0]
for i in km.labels_]).reshape((h,w,3))
plti(dog)
```

We can now use a a contour tracing algorithm from Scikit-Image to extract the paths round the dogIn \[25]:
```
from skimage import measure
seg = np.asarray([(1 if i == 1 else 0)
for i in km.labels_]).reshape((h,w))
contours = measure.find_contours(seg, 0.5, fully_connected="high")
simplified_contours = [measure.approximate_polygon(c, tolerance=5) for c in contours]
plt.figure(figsize=(5,10))
for n, contour in enumerate(simplified_contours):
plt.plot(contour[:, 1], contour[:, 0], linewidth=2)
plt.ylim(h,0)
plt.axes().set_aspect('equal')
```

When tracing shapes it it worth playing with the tolerance parameter. This controls how accurately the path follows the original bitmap shape. As our image is fairly noisey, I've turned this up quiet high to "smooth" out the image. The result is a fairly jagged polygons.
To plot the image, we can convert these contour paths to patches and fill them with matplotlib:In \[27]:
```
from matplotlib.patches import PathPatch
from matplotlib.path import Path
# flip the path coordinates so it is consistent with matplotlib
paths = [[[v[1], v[0]] for v in vs] for vs in simplified_contours]
def get_path(vs):
codes = [Path.MOVETO] + [Path.LINETO] * (len(vs)-2) + [Path.CLOSEPOLY]
return PathPatch(Path(vs, codes))
plt.figure(figsize=(5,10))
ax = plt.gca()
for n, path in enumerate(paths):
ax.add_patch(get_path(path))
plt.ylim(h,0)
plt.xlim(0,w)
plt.axes().set_aspect('equal')
```

And we run into the problem that some of the contours we've found are not the outside edge of the shape, but the inside edge. To get round this I use the following hackey code.
We check whether a point is within a polygon using the [ray casting method](https://en.wikipedia.org/wiki/Point_in_polygon), and rely on the fact the for our specific case polygons don't overlap with each other: one polygon is either inside another or not. Finally the subsume function arranges all the polygons into our polygon object, which describes the outside and possible inside edges of the shapesIn \[28]:
```
class Polygon:
def __init__(self, outer, inners):
self.outer = outer
self.inners = inners
def clone(self):
return Polygon(self.outer[:], [c.clone() for c in self.inners])
def crosses_line(point, line):
"""
Checks if the line project in the positive x direction from point
crosses the line between the two points in line
"""
p1,p2 = line
x,y = point
x1,y1 = p1
x2,y2 = p2
if x <= min(x1,x2) or x >= max(x1,x2):
return False
dx = x1 - x2
dy = y1 - y2
if dx == 0:
return True
m = dy / dx
if y1 + m * (x - x1) <= y:
return False
return True
def point_within_polygon(point, polygon):
"""
Returns true if point within polygon
"""
crossings = 0
for i in range(len(polygon.outer)-1):
line = (polygon.outer[i], polygon.outer[i+1])
crossings += crosses_line(point, line)
if crossings % 2 == 0:
return False
return True
def polygon_inside_polygon(polygon1, polygon2):
"""
Returns true if the first point of polygon1 is inside
polygon 2
"""
return point_within_polygon(polygon1.outer[0], polygon2)
def subsume(original_list_of_polygons):
"""
Takes a list of polygons and returns polygons with insides.
This function makes the unreasonable assumption that polygons can
only be complete contained within other polygons (e.g. not overlaps).
In the case where polygons are nested more then three levels,
"""
list_of_polygons = [p.clone() for p in original_list_of_polygons]
polygons_outside = [p for p in list_of_polygons
if all(not polygon_inside_polygon(p, p2)
for p2 in list_of_polygons
if p2 != p)]
polygons_inside = [p for p in list_of_polygons
if any(polygon_inside_polygon(p, p2)
for p2 in list_of_polygons
if p2 != p)]
for outer_polygon in polygons_outside:
for inner_polygon in polygons_inside:
if polygon_inside_polygon(inner_polygon, outer_polygon):
outer_polygon.inners.append(inner_polygon)
return polygons_outside
for p in polygons_outside:
p.inners = subsume(p.inners)
return polygons_outside
```
In \[29]:
```
polygons = [Polygon(p,[]) for p in paths]
subsumed_polygons = subsume(polygons)
```
In \[30]:
```
def build_path_patch(polygon, **kwargs):
"""
Builds a matplotlb patch to plot a complex polygon described
by the Polygon class.
"""
verts = polygon.outer[:]
codes = [Path.MOVETO] + [Path.LINETO] * (len(verts)-2) + [Path.CLOSEPOLY]
for inside_path in polygon.inners:
verts_tmp = inside_path.outer
codes_tmp = [Path.MOVETO] + [Path.LINETO] * (len(verts_tmp)-2) + [Path.CLOSEPOLY]
verts += verts_tmp
codes += codes_tmp
drawn_path = Path(verts, codes)
return PathPatch(drawn_path, **kwargs)
```
Finally we can plot our polygons with a random colour.In \[31]:
```
def rnd_color():
"""Returns a randon (R,G,B) tuple"""
return tuple(np.random.random(size=3))
plt.figure(figsize=(5,10))
ax = plt.gca()
c = rnd_color()
for n, polygon in enumerate(subsumed_polygons):
ax.add_patch(build_path_patch(polygon, lw=0, facecolor=c))
plt.ylim(h,0)
plt.xlim(0,w)
ax.set_axis_bgcolor('k')
plt.axes().set_aspect('equal')
plt.show()
```

And with that I'm done. In this post I have only really scratched the surface with what can be done with image processing, but it already feels like I have written a lot, so I'm going to leave it here. For more ideas of what can be done, I suggest looking at the examples of a number of image libraries.
## This Notebook
The jupyter notebook for this post can be found on github, [here](https://github.com/ijmbarr/image-processing-with-numpy).
Reference :
```

psychedelic.
## To Greyscale
On the topic of colour, we can also transform the image to greyscale easily. There are a number of ways to do this, but a straight forward way is to take the weighted mean of the RGB value of original image:In \[9]:
```
def to_grayscale(im, weights = np.c_[0.2989, 0.5870, 0.1140]):
"""
Transforms a colour image to a greyscale image by
taking the mean of the RGB values, weighted
by the matrix weights
"""
tile = np.tile(weights, reps=(im.shape[0],im.shape[1],1))
return np.sum(tile * im, axis=2)
```
In \[10]:
```
img = to_grayscale(im)
plti(img, cmap='Greys')
```

## Convoluted
Another of the basic operations you can apply to an image is a convolution. It is defined as
C(x,y)=∫dx′dy′I(x+x′,y+y′)W(x′,y′)C(x,y)=∫dx′dy′I(x+x′,y+y′)W(x′,y′)
Where CC is the convoluted image, II is the original image and WW is a window function. Essentially we are replacing each pixel with a weighted sum of nearby pixels.
Because convolutions can be expensive, let's start by shrinking the imageIn \[11]:
```
from scipy.ndimage.interpolation import zoom
im_small = zoom(im, (0.2,0.2,1))
```
We can now apply a uniform window to the image. This has the effect of bluring the image, by averaging each pixel with those nearbyIn \[12]:
```
from scipy.signal import convolve2d
def convolve_all_colours(im, window):
"""
Convolves im with window, over all three colour channels
"""
ims = []
for d in range(3):
im_conv_d = convolve2d(im[:,:,d], window, mode="same", boundary="symm")
ims.append(im_conv_d)
im_conv = np.stack(ims, axis=2).astype("uint8")
return im_conv
n=50
window = np.ones((n,n))
window /= np.sum(window)
plti(convolve_all_colours(im_small, window))
```

For blurring an image, there is a whole host of different windows and functions that can be used. The most common I have found are the uniform window, the Gaussian window and the median filter. To get a feel what these are doing to an image, I apply all of these filters to our image, for different window sizesIn \[13]:
```
from scipy.ndimage import median_filter
def make_gaussian_window(n, sigma=1):
"""
Creates a square window of size n by n of weights from a gaussian
of width sigma.
"""
nn = int((n-1)/2)
a = np.asarray([[x**2 + y**2 for x in range(-nn,nn+1)] for y in range(-nn,nn+1)])
return np.exp(-a/(2*sigma**2))
def median_filter_all_colours(im_small, window_size):
"""
Applies a median filer to all colour channels
"""
ims = []
for d in range(3):
im_conv_d = median_filter(im_small[:,:,d], size=(window_size,window_size))
ims.append(im_conv_d)
im_conv = np.stack(ims, axis=2).astype("uint8")
return im_conv
window_sizes = [9,17,33,65]
fig, axs = plt.subplots(nrows=3, ncols=len(window_sizes), figsize=(15,15));
# mean filter
for w, ax in zip(window_sizes, axs[0]):
window = np.ones((w,w))
window /= np.sum(window)
ax.imshow(convolve_all_colours(im_small, window));
ax.set_title("Mean Filter: window size: {}".format(w));
ax.set_axis_off();
# gaussian filter
for w, ax in zip(window_sizes, axs[1]):
window = make_gaussian_window(w,sigma=w)
window /= np.sum(window)
ax.imshow(convolve_all_colours(im_small, window));
ax.set_title("Gaussian Filter: window size: {}".format(w));
ax.set_axis_off();
# median filter
for w, ax in zip(window_sizes, axs[2]):
ax.imshow(median_filter_all_colours(im_small, w));
ax.set_title("Median Filter: window size: {}".format(w));
ax.set_axis_off();
```

Blurring is only one use of convolutions in image processing. By using more exotic windows, was can extract different kinds of information. The [Sobel filter](https://www.degeneratestate.org/posts/2016/Oct/23/image-processing-with-numpy/) tried to approximate the gradients of the image along one direction using window functions of the form
```
[[-1,0,1],
[-2,0,2],
[-1,0,1]]
```
By finding the gradient in both the X and Y directions, and then taking the magnitude of these values we get a map of the gradients in an image for each colourIn \[14]:
```
%%time
n=100
sobel_x = np.c_[
[-1,0,1],
[-2,0,2],
[-1,0,1]
]
sobel_y = np.c_[
[1,2,1],
[0,0,0],
[-1,-2,-1]
]
ims = []
for d in range(3):
sx = convolve2d(im_small[:,:,d], sobel_x, mode="same", boundary="symm")
sy = convolve2d(im_small[:,:,d], sobel_y, mode="same", boundary="symm")
ims.append(np.sqrt(sx*sx + sy*sy))
im_conv = np.stack(ims, axis=2).astype("uint8")
plti(im_conv)
```
```
CPU times: user 184 ms, sys: 0 ns, total: 184 ms
Wall time: 182 ms
```

The results are pretty impressive. By combining filtering and gradient finding operations together we can generate some strange patterns that resemble the original image but are distorted in interesting ways. The best I have found so far is combining a large window median filter with a Sobel filterIn \[15]:
```
im_smoothed = median_filter_all_colours(im_small, 71)
sobel_x = np.c_[
[-1,0,1],
[-2,0,2],
[-1,0,1]
]
sobel_y = np.c_[
[1,2,1],
[0,0,0],
[-1,-2,-1]
]
ims = []
for d in range(3):
sx = convolve2d(im_smoothed[:,:,d], sobel_x, mode="same", boundary="symm")
sy = convolve2d(im_smoothed[:,:,d], sobel_y, mode="same", boundary="symm")
ims.append(np.sqrt(sx*sx + sy*sy))
im_conv = np.stack(ims, axis=2).astype("uint8")
plti(im_conv)
```

So far we've looked at applying the same operations to all colour channels at once. If we blur only one colour channel at a time, we get the following eerie effectsIn \[16]:
```
fig, axs = plt.subplots(nrows=1, ncols=4, figsize=(15,5))
ax= axs[0]
ax.imshow(im_small)
ax.set_title("Original", fontsize=20)
ax.set_axis_off()
w=75
window = np.ones((w,w))
window /= np.sum(window)
ax= axs[1]
ims = []
for d in range(3):
if d == 0:
im_conv_d = convolve2d(im_small[:,:,d],window, mode="same", boundary="symm")
else:
im_conv_d = im_small[:,:,d]
ims.append(im_conv_d)
ax.imshow(np.stack(ims, axis=2).astype("uint8"))
ax.set_title("Red Blur", fontsize=20)
ax.set_axis_off()
ax= axs[2]
ims = []
for d in range(3):
if d == 1:
im_conv_d = convolve2d(im_small[:,:,d], window, mode="same", boundary="symm")
else:
im_conv_d = im_small[:,:,d]
ims.append(im_conv_d)
ax.imshow(np.stack(ims, axis=2).astype("uint8"))
ax.set_title("Blue Blur", fontsize=20)
ax.set_axis_off()
ax= axs[3]
ims = []
for d in range(3):
if d == 2:
im_conv_d = convolve2d(im_small[:,:,d], window, mode="same", boundary="symm")
else:
im_conv_d = im_small[:,:,d]
ims.append(im_conv_d)
ax.imshow(np.stack(ims, axis=2).astype("uint8"))
ax.set_title("Green Blur", fontsize=20)
ax.set_axis_off()
```

## Segmentation
Another major area of image processing is segmenting the image into different regions, for example foreground and background. There are a number of ways to do this, and I will only look at a few here.
The simplest is to convert the image to greyscale, and find a threshold. Pixels with a value above the threshold are treated as belonging to one region, and below another region. We can explore how different choosing different thresholds segments our greyscale image belowIn \[16]:
```
def simple_threshold(im, threshold=128):
return ((im > threshold) * 255).astype("uint8")
thresholds = [100,120,128,138,150]
fig, axs = plt.subplots(nrows=1, ncols=len(thresholds), figsize=(20,5));
gray_im = to_grayscale(im)
for t, ax in zip(thresholds, axs):
ax.imshow(simple_threshold(gray_im, t), cmap='Greys');
ax.set_title("Threshold: {}".format(t), fontsize=20);
ax.set_axis_off();
```

How exactly we choose a threshold is going to be application specific. However, we might argue that we would expect the backgroud pixel values to be similar in value to other background pixel values, and the same for the foreground. One way to quantify this is to say that we are looking for the threshold which minimises the inter pixel variance in the foreground and background. One way to calculate this is [Otsu threshold algorithm](https://www.degeneratestate.org/posts/2016/Oct/23/image-processing-with-numpy/), implemented belowIn \[17]:
```
def otsu_threshold(im):
pixel_counts = [np.sum(im == i) for i in range(256)]
s_max = (0,-10)
ss = []
for threshold in range(256):
# update
w_0 = sum(pixel_counts[:threshold])
w_1 = sum(pixel_counts[threshold:])
mu_0 = sum([i * pixel_counts[i] for i in range(0,threshold)]) / w_0 if w_0 > 0 else 0
mu_1 = sum([i * pixel_counts[i] for i in range(threshold, 256)]) / w_1 if w_1 > 0 else 0
# calculate
s = w_0 * w_1 * (mu_0 - mu_1) ** 2
ss.append(s)
if s > s_max[1]:
s_max = (threshold, s)
return s_max[0]
t = otsu_threshold(gray_im)
plti(simple_threshold(gray_im, t), cmap='Greys')
```

It's not great. However, we might think that by converting our image to greyscale we are throwing away information. We can apply the same process to each colour channel separately to getIn \[18]:
```
fig, axs = plt.subplots(nrows=1, ncols=3, figsize=(15,5))
c_ims = []
for c, ax in zip(range(3), axs):
tmp_im = im[:,:,c]
t = otsu_threshold(tmp_im)
tmp_im = simple_threshold(tmp_im, t)
ax.imshow(tmp_im, cmap='Greys')
c_ims.append(tmp_im)
ax.set_axis_off()
```

A natural way to combine each channel into one image is to take the intersection of each thresholded colour channelIn \[19]:
```
plti(c_ims[0] & c_ims[1] & c_ims[2], cmap='Greys')
```

Which works much better then just looking at the greyscale image.
We can be more direct in our approach though. In Otsu thresholding, we found the threshold which minimised the inter-segment pixel variance. If rather then looking for a threshold, we look for clusters in colour space, we end up with the [K-means](https://en.wikipedia.org/wiki/K-means_clustering) clustering technique. Applying this directed to the coloured image, we getIn \[20]:
```
from sklearn.cluster import KMeans
h,w = im_small.shape[:2]
im_small_long = im_small.reshape((h * w, 3))
im_small_wide = im_small_long.reshape((h,w,3))
km = KMeans(n_clusters=3)
km.fit(im_small_long)
cc = km.cluster_centers_.astype(np.uint8)
out = np.asarray([cc[i] for i in km.labels_]).reshape((h,w,3))
plti(out)
```

Which isn't bad at all. By randomly assigning colours to each of the segments we can create artIn \[21]:
```
rng = range(4)
fig, axs = plt.subplots(nrows=1, ncols=len(rng), figsize=(15,5))
gray_im = to_grayscale(im)
for t, ax in zip(rng, axs):
rnd_cc = np.random.randint(0,256, size = (3,3))
out = np.asarray([rnd_cc[i] for i in km.labels_]).reshape((h,w,3))
ax.imshow(out)
ax.set_axis_off()
```

## Vectorization
So far we have treated an image as a bitmap. As a final step, I am going to extract the segment of the dog from the image, and convert it into a vectorise image.
Let's start by grabbing the segment of the dog:In \[23]:
```
dog = np.asarray([cc[i] if i == 1 else [0,0,0]
for i in km.labels_]).reshape((h,w,3))
plti(dog)
```

We can now use a a contour tracing algorithm from Scikit-Image to extract the paths round the dogIn \[25]:
```
from skimage import measure
seg = np.asarray([(1 if i == 1 else 0)
for i in km.labels_]).reshape((h,w))
contours = measure.find_contours(seg, 0.5, fully_connected="high")
simplified_contours = [measure.approximate_polygon(c, tolerance=5) for c in contours]
plt.figure(figsize=(5,10))
for n, contour in enumerate(simplified_contours):
plt.plot(contour[:, 1], contour[:, 0], linewidth=2)
plt.ylim(h,0)
plt.axes().set_aspect('equal')
```

When tracing shapes it it worth playing with the tolerance parameter. This controls how accurately the path follows the original bitmap shape. As our image is fairly noisey, I've turned this up quiet high to "smooth" out the image. The result is a fairly jagged polygons.
To plot the image, we can convert these contour paths to patches and fill them with matplotlib:In \[27]:
```
from matplotlib.patches import PathPatch
from matplotlib.path import Path
# flip the path coordinates so it is consistent with matplotlib
paths = [[[v[1], v[0]] for v in vs] for vs in simplified_contours]
def get_path(vs):
codes = [Path.MOVETO] + [Path.LINETO] * (len(vs)-2) + [Path.CLOSEPOLY]
return PathPatch(Path(vs, codes))
plt.figure(figsize=(5,10))
ax = plt.gca()
for n, path in enumerate(paths):
ax.add_patch(get_path(path))
plt.ylim(h,0)
plt.xlim(0,w)
plt.axes().set_aspect('equal')
```

And we run into the problem that some of the contours we've found are not the outside edge of the shape, but the inside edge. To get round this I use the following hackey code.
We check whether a point is within a polygon using the [ray casting method](https://en.wikipedia.org/wiki/Point_in_polygon), and rely on the fact the for our specific case polygons don't overlap with each other: one polygon is either inside another or not. Finally the subsume function arranges all the polygons into our polygon object, which describes the outside and possible inside edges of the shapesIn \[28]:
```
class Polygon:
def __init__(self, outer, inners):
self.outer = outer
self.inners = inners
def clone(self):
return Polygon(self.outer[:], [c.clone() for c in self.inners])
def crosses_line(point, line):
"""
Checks if the line project in the positive x direction from point
crosses the line between the two points in line
"""
p1,p2 = line
x,y = point
x1,y1 = p1
x2,y2 = p2
if x <= min(x1,x2) or x >= max(x1,x2):
return False
dx = x1 - x2
dy = y1 - y2
if dx == 0:
return True
m = dy / dx
if y1 + m * (x - x1) <= y:
return False
return True
def point_within_polygon(point, polygon):
"""
Returns true if point within polygon
"""
crossings = 0
for i in range(len(polygon.outer)-1):
line = (polygon.outer[i], polygon.outer[i+1])
crossings += crosses_line(point, line)
if crossings % 2 == 0:
return False
return True
def polygon_inside_polygon(polygon1, polygon2):
"""
Returns true if the first point of polygon1 is inside
polygon 2
"""
return point_within_polygon(polygon1.outer[0], polygon2)
def subsume(original_list_of_polygons):
"""
Takes a list of polygons and returns polygons with insides.
This function makes the unreasonable assumption that polygons can
only be complete contained within other polygons (e.g. not overlaps).
In the case where polygons are nested more then three levels,
"""
list_of_polygons = [p.clone() for p in original_list_of_polygons]
polygons_outside = [p for p in list_of_polygons
if all(not polygon_inside_polygon(p, p2)
for p2 in list_of_polygons
if p2 != p)]
polygons_inside = [p for p in list_of_polygons
if any(polygon_inside_polygon(p, p2)
for p2 in list_of_polygons
if p2 != p)]
for outer_polygon in polygons_outside:
for inner_polygon in polygons_inside:
if polygon_inside_polygon(inner_polygon, outer_polygon):
outer_polygon.inners.append(inner_polygon)
return polygons_outside
for p in polygons_outside:
p.inners = subsume(p.inners)
return polygons_outside
```
In \[29]:
```
polygons = [Polygon(p,[]) for p in paths]
subsumed_polygons = subsume(polygons)
```
In \[30]:
```
def build_path_patch(polygon, **kwargs):
"""
Builds a matplotlb patch to plot a complex polygon described
by the Polygon class.
"""
verts = polygon.outer[:]
codes = [Path.MOVETO] + [Path.LINETO] * (len(verts)-2) + [Path.CLOSEPOLY]
for inside_path in polygon.inners:
verts_tmp = inside_path.outer
codes_tmp = [Path.MOVETO] + [Path.LINETO] * (len(verts_tmp)-2) + [Path.CLOSEPOLY]
verts += verts_tmp
codes += codes_tmp
drawn_path = Path(verts, codes)
return PathPatch(drawn_path, **kwargs)
```
Finally we can plot our polygons with a random colour.In \[31]:
```
def rnd_color():
"""Returns a randon (R,G,B) tuple"""
return tuple(np.random.random(size=3))
plt.figure(figsize=(5,10))
ax = plt.gca()
c = rnd_color()
for n, polygon in enumerate(subsumed_polygons):
ax.add_patch(build_path_patch(polygon, lw=0, facecolor=c))
plt.ylim(h,0)
plt.xlim(0,w)
ax.set_axis_bgcolor('k')
plt.axes().set_aspect('equal')
plt.show()
```

And with that I'm done. In this post I have only really scratched the surface with what can be done with image processing, but it already feels like I have written a lot, so I'm going to leave it here. For more ideas of what can be done, I suggest looking at the examples of a number of image libraries.
## This Notebook
The jupyter notebook for this post can be found on github, [here](https://github.com/ijmbarr/image-processing-with-numpy).
Reference :