📉
Tutorials
  • Computer History
  • Function
    • Finance
      • Calculate
    • Manage Data
    • Date&Time
    • Strings and Character
  • Snippets
    • Web Application
      • Hugo
      • JavaScript
        • Stopwatch using JavaScript?
    • Note
    • Start Project
      • GitHub
      • GitLab
    • Python Programming
      • Strings and Character Data
      • List
      • Dictionaries
    • Data Science
      • Setting Option
      • Get Data
  • Link Center
    • Next Articles
    • Google
    • Excel VBA
    • Python
      • Notebook
    • WebApp
      • Vue.js
    • Finance
    • Project
      • Kids
        • Scratch
      • Finance
        • Plotly.js
        • Portfolio
      • Mini Lab
        • Systems Administration
        • Auto Adjust Image
      • Sending Emails
      • ECS
        • Knowledge Base
        • ระบบผู้เชี่ยวชาญ (Expert System)
        • Check product
        • Compare two SQL databases
      • e-Library
        • Knowledge base
        • การจัดหมวดหมู่ห้องสมุด
        • Temp
      • AppSheet
        • บัญชีรายรับรายจ่าย
      • Weather App
      • COVID-19
  • Tutorials
    • Data Science
      • Data Science IPython notebooks
    • UX & UI
      • 7 กฎการออกแบบ UI
    • Web Scraping
      • Scrape Wikipedia Articles
      • Quick Start
    • GUI
      • pysimple
        • Create a GUI
      • Tkinter
        • Python Tkinter Tutorial
      • PyQt
        • PyQt Tutorial
    • MachineLearning
      • การพัฒนา Chat Bot
      • AI ผู้ช่วยใหม่ในการทำ Customer Segmentation
      • Customer Segmentation
      • ตัดคำภาษาไทย ด้วย PyThaiNLP API
    • Excel & VBA
      • INDEX กับ MATCH
      • รวมสูตร Excel ปี 2020
      • How to Write Code in a Spreadsheet
    • Visualization
      • Bokeh
        • Part I: Getting Started
        • Data visualization
        • Plotting a Line Graph
        • Panel Document
        • Interactive Data Visualization
    • VueJS
      • VueJS - Quick Guide
    • Django
      • Customize the Django Admin
      • พัฒนาเว็บด้วย Django
    • Git
      • วิธีสร้าง SSH Key
      • Git คืออะไร
      • เริ่มต้นใช้งาน Git
      • การใช้งาน Git และ Github
      • รวม 10 คำสั่ง Git
      • GIT Push and Pull
    • Finance
      • Stock Analysis using Pandas (Series)
      • Building Investment AI for fintech
      • Resampling Time Series
      • Python for Finance (Series)
      • Stock Data Analysis (Second Edition)
      • Get Stock Data Using Python
      • Stock Price Trend Analysis
      • Calculate Stock Returns
      • Quantitative Trading
      • Backtrader for Backtesting
      • Binance Python API
      • Pine Script (TradingView)
      • Stocks Analysis with Pandas and Scikit-Learn
      • Yahoo Finance API
      • Sentiment Analysis
      • yfinance Library
      • Stock Data Analysis
      • YAHOO_FIN
      • Algorithmic Trading
    • JavaScript
      • Split a number
      • Callback Function
      • The Best JavaScript Examples
      • File and FileReader
      • JavaScript Tutorial
      • Build Reusable HTML Components
      • Developing JavaScript components
      • JavaScript - Quick Guide
      • JavaScript Style Guide()
      • Beginner's Handbook
      • Date Now
    • Frontend
      • HTML
        • File Path
      • Static Site Generators.
        • Creating a New Theme
    • Flask
      • Flask - Quick Guide
      • Flask Dashboards
        • Black Dashboard
        • Light Blue
        • Flask Dashboard Argon
      • Create Flask App
        • Creating First Application
        • Rendering Pages Using Jinja
      • Jinja Templates
        • Primer on Jinja Templating
        • Jinja Template Document
      • Learning Flask
        • Ep.1 Your first Flask app
        • Ep.2 Flask application structure
        • Ep.3 Serving HTML files
        • Ep.4 Serving static files
        • Ep.5 Jinja template inheritance
        • Ep.6 Jinja template design
        • Ep.7 Working with forms in Flask
        • Ep.8 Generating dynamic URLs in Flask
        • Ep.9 Working with JSON data
        • Ep.23 Deploying Flask to a VM
        • Ep.24 Flask and Docker
        • Ep. 25: uWSGI Introduction
        • Ep. 26 Flask before and after request
        • Ep. 27 uWSGI Decorators
        • Ep. 28 uWSGI Decorators
        • Ep. 29 Flask MethodView
        • Ep. 30 Application factory pattern
      • The Flask Mega-Tutorial
        • Chapter 2: Templates
      • Building Flask Apps
      • Practical Flask tutorial series
      • Compiling SCSS to CSS
      • Flask application structure
    • Database
      • READING FROM DATABASES
      • SQLite
        • Data Management
        • Fast subsets of large datasets
      • Pickle Module
        • How to Persist Objects
      • Python SQL Libraries
        • Create Python apps using SQL Server
    • Python
      • Python vs JavaScript
      • Python Pillow – Adjust Image
      • Python Library for Google Search
      • Python 3 - Quick Guide
      • Regular Expressions
        • Python Regular Expressions
        • Regular Expression (RegEx)
        • Validate ZIP Codes
        • Regular Expression Tutorial
      • Python Turtle
      • Python Beginner's Handbook
      • From Beginner to Pro
      • Standard Library
      • Datetime Tutorial
        • Manipulate Times, Dates, and Time Spans
      • Work With a PDF
      • geeksforgeeks.org
        • Python Tutorial
      • Class
      • Modules
        • Modules List
        • pickle Module
      • Working With Files
        • Open, Read, Append, and Other File Handling
        • File Manipulation
        • Reading & Writing to text files
      • Virtual Environments
        • Virtual Environments made easy
        • Virtual Environmen
        • A Primer
        • for Beginners
      • Functions
        • Function Guide
        • Inner Functions
      • Learning Python
        • Pt. 4 Python Strings
        • Pt. 3 Python Variables
      • Zip Function
      • Iterators
      • Try and Except
        • Exceptions: Introduction
        • Exceptions Handling
        • try and excep
        • Errors and Exceptions
        • Errors & Exceptions
      • Control Flow
      • Lambda Functions
        • Lambda Expression คืออะไร
        • map() Function
      • Date and Time
        • Python datetime()
        • Get Current Date and Time
        • datetime in Python
      • Awesome Python
      • Dictionary
        • Dictionary Comprehension
        • ALL ABOUT DICTIONARIES
        • DefaultDict Type for Handling Missing Keys
        • The Definitive Guide
        • Why Functions Modify Lists and Dictionaries
      • Python Structures
      • Variable & Data Types
      • List
        • Lists Explained
        • List Comprehensions
          • Python List Comprehension
          • List Comprehensions in 5-minutes
          • List Comprehension
        • Python List
      • String
        • Strings and Character Data
        • Splitting, Concatenating, and Joining Strings
      • String Formatting
        • Improved String Formatting Syntax
        • String Formatting Best Practices
        • Remove Space
        • Add Spaces
      • Important basic syntax
      • List all the packages
      • comment
    • Pandas
      • Tutorial (GeeksforGeeks)
      • 10 minutes to pandas
      • Options and settings
      • เริ่มต้น Set Up Kaggle.com
      • Pandas - Quick Guide
      • Cookbook
      • NumPy
        • NumPy Package for Scientific
      • IO tools (text, CSV, …)
      • pandas.concat
      • Excel & Google Sheets
        • A Guide to Excel
        • Quickstart to the Google Sheets
        • Python Excel Tutorial: The Definitive Guide
      • Working With Text Data
        • Quickstart
      • API Reference
      • Groupby
      • DateTime Methods
      • DataFrame
      • sort_values()
      • Pundit: Accessing Data in DataFrames
      • datatable
        • DataFrame: to_json()
        • pydatatable
      • Read and Write Files
      • Data Analysis with Pandas
      • Pandas and Python: Top 10
      • 10 minutes to pandas
      • Getting Started with Pandas in Python
    • Markdown
      • Create Responsive HTML Emails
      • Using Markup Languages with Hugo
    • AngularJS
      • Learn AngularJS
    • CSS
      • The CSS Handbook
      • Box Shadow
      • Image Center
      • The CSS Handbook
      • The CSS Handbook
      • Loading Animation
      • CSS Grid Layout
      • Background Image Size
      • Flexbox
  • Series
    • จาวาสคริปต์เบื้องต้น
      • 1: รู้จักกับจาวาสคริปต์
  • Articles
    • Visualization
      • Dash
        • Introducing Dash
    • Finance
      • PyPortfolioOpt
      • Best Libraries for Finance
      • Detection of price support
      • Portfolio Optimization
      • Python Packages For Finance
    • Django
      • เริ่มต้น Django RestFramework
    • General
      • Heroku คืออะไร
      • How to Crack Passwords
    • Notebook
      • IPython Documentation
      • Importing Notebooks
      • Google Colab for Data Analytics
      • Creating Interactive Dashboards
      • The Definitive Guide
      • A gallery of interesting Jupyter Notebooks
      • Advanced Jupyter Notebooks
      • Converting HTML to Notebook
    • Pandas
      • Pandas_UI
      • Pandas Style API
      • Difference Between two Dataframes
      • 19 Essential Snippets in Pandas
      • Time Series Analysis
      • Selecting Columns in a DataFrame
      • Cleaning Up Currency Data
      • Combine Multiple Excel Worksheets
      • Stylin’ with Pandas
      • Pythonic Data Cleaning
      • Make Excel Faster
      • Reading Excel (xlsx) Files
      • How to use iloc and loc for Indexing
      • The Easiest Data Cleaning Method
    • Python
      • pip install package
      • Automating your daily tasks
      • Convert Speech to Text
      • Tutorial, Project Ideas, and Tips
      • Image Handling and Processing
        • Image Processing Part I
        • Image Processing Part II
        • Image tutorial
        • Image Processing with Numpy
        • Converts PIL Image to Numpy Array
      • Convert Dictionary To JSON
      • JSON Dump
      • Speech-to-Text Model
      • Convert Text to Speech
      • Tips & Tricks
        • Fundamentals for Data Science
        • Best Python Code Examples
        • Top 50 Tips & Tricks
        • 11 Beginner Tips
        • 10 Tips & Tricks
      • Password hashing
      • psutil
      • Lambda Expressions
    • Web Scraping
      • Web Scraping using Python
      • Build a Web Scraper
      • Web Scraping for beginner
      • Beautiful Soup
      • Scrape Websites
      • Python Web Scraping
        • Web Scraping Part 1
        • Web Scraping Part 2
        • Web Scraping Part 3
        • Web Scraping Part 4
      • Web Scraper
    • Frontend
      • Book Online with GitBook
      • Progressive Web App คืออะไร
      • self-host a Hugo web app
  • Examples
    • Django
      • Build a Portfolio App
      • SchoolManagement
    • Flask
      • Flask Stock Visualizer
      • Flask by Example
      • Building Flask Apps
      • Flask 101
    • OpenCV
      • Build a Celebrity Look-Alike
      • Face Detection-OpenCV
    • Python
      • Make Game FLASH CARD
      • Sending emails using Google
      • ตรวจหาภาพซ้ำด้วย Perceptual hashing
        • Sending Emails in Python
      • Deck of Cards
      • Extract Wikipedia Data
      • Convert Python File to EXE
      • Business Machine Learning
      • python-business-analytics
      • Simple Blackjack Game
      • Python Turtle Clock
      • Countdown
      • 3D Animation : Moon Phases
      • Defragmentation Algorithm
      • PDF File
        • จัดการข้อความ และรูป จากไฟล์ PDF ด้วย PDFBox
      • Reading and Generating QR codes
      • Generating Password
        • generate one-time password (OTP)
        • Random Password Generator
        • Generating Strong Password
      • PyQt: Building Calculator
      • List Files in a Directory
      • [Project] qID – โปรแกรมแต่งรูปง่ายๆ เพื่อการอัพลงเว็บ
      • Python and Google Docs to Build Books
      • Tools for Record Linking
      • Create Responsive HTML Email
      • psutil()
      • Transfer Learning for Deep Learning
      • ดึงข้อมูลคุณภาพอากาศประเทศไทย
        • Image Classification
    • Web Scraper
      • Scrape Wikipedia Articles
        • Untitled
      • How Scrape Websites with Python 3
    • Finance
      • Algorithmic Trading for Beginners
      • Parse TradingView Stock
      • Creating a stock price database with MariaDB and python
      • Source Code
        • stocks-list
      • Visualizing with D3
      • Real Time Stock in Excel using Python
      • Create Stock Quote Module
      • The Magic Formula Lost Its Sparkle?
      • Stock Market Analysis
      • Stock Portfolio Analyses Part 1
      • Stock Portfolio Analyses Part 2
      • Build A Dashboard In Python
      • Stock Market Predictions with LSTM
      • Trading example
      • Algorithmic Trading Strategies
      • DOWNLOAD FUNDAMENTALS DATA
      • Algorithmic Trading
      • numfin
      • Financial Machine Learning
      • Algorithm To Predict Stock Direction
      • Interactive Brokers API Code
      • The (Artificially) Intelligent Investor
      • Create Auto-Updating Excel of Stock Market
      • Stock Market Predictions
      • Automate Your Stock Portfolio
      • create an analytics dashboard
      • Bitcoin Price Notifications
      • Portfolio Management
    • WebApp
      • CSS
        • The Best CSS Examples
      • JavaScript
        • Memory Game
      • School Clock
      • Frontend Tutorials & Example
      • Side Menu Bar with sub-menu
      • Create Simple CPU Monitor App
      • Vue.js building a converter app
      • jQuery
        • The Best jQuery Examples
      • Image Slideshow
      • Handle Timezones
      • Text to Speech with Javascript
      • Building Blog for Your Portfolio
      • Responsive Website Layout
      • Maths Homework Generator
  • Books
    • Finance
      • Python for Finance (O'Reilly)
    • Website
      • Hugo
        • Go Bootcamp
        • Hugo in Action.
          • About this MEAP
          • Welcome
          • 1. The JAM stack with Hugo
          • 2. Live in 30 minutes
          • 3. Using Markup for content
          • 4. Content Management with Hugo
          • 5. Custom Pages and Customized Content
          • 6. Structuring web pages
          • A Appendix A.
          • B Appendix B.
          • C Appendix C.
    • Python
      • ภาษาไพธอนเบื้องต้น
      • Python Cheatsheet
        • Python Cheatsheet
      • Beginning Python
      • IPython Cookbook
      • The Quick Python Book
        • Case study
        • Part 1. Starting out
          • 1. About Python
          • 2. Getting started
          • 3. The Quick Python overview
        • Part 2. The essentials
          • 14. Exceptions
          • 13. Reading and writing files
          • 12. Using the filesystem
          • 11. Python programs
          • 10. Modules and scoping rules
          • 9. Functions
          • 8. Control flow
          • 4. The absolute basics
          • 5. Lists, tuples, and sets
          • 6. Strings
          • 7. Dictionaries
        • Part 3. Advanced language features
          • 19. Using Python libraries
          • 18. Packages
          • 17. Data types as objects
          • 16. Regular expressions
          • 15. Classes and OOP
        • Part 4. Working with data
          • Appendix B. Exercise answers
          • Appendix A. Python’s documentation
          • 24. Exploring data
          • 23. Saving data
          • 20. Basic file wrangling
          • 21. Processing data files
          • 22. Data over the network
      • The Hitchhiker’s Guide to Python
      • A Whirlwind Tour of Python
        • 9. Defining Functions
      • Automate the Boring Stuff
        • 4. Lists
        • 5. Dictionaries
        • 12. Web Scraping
        • 13. Excel
        • 14. Google Sheets
        • 15. PDF and Word
        • 16. CSV and JSON
    • IPython
    • Pandas
      • จัดการข้อมูลด้วย pandas เบื้องต้น
      • Pandas Tutorial
  • Link Center
    • Temp
  • เทควันโด
    • รวมเทคนิค
    • Help and Documentation
  • Image
    • Logistics
Powered by GitBook
On this page
  • Web Scraping using Beautiful Soup
  • Data Manipulation and Cleaning
  • Data Analysis and Visualization
  • Conclusion

Was this helpful?

  1. Articles
  2. Web Scraping

Web Scraping using Python

July 26th, 2018

PreviousWeb ScrapingNextBuild a Web Scraper

Last updated 4 years ago

Was this helpful?

In this tutorial, you'll learn how to extract data from the web, manipulate and clean data using Python's Pandas library, and data visualize using Python's Matplotlib library.

Web scraping is a term used to describe the use of a program or algorithm to extract and process large amounts of data from the web. Whether you are a data scientist, engineer, or anybody who analyzes large amounts of datasets, the ability to scrape data from the web is a useful skill to have. Let's say you find data from the web, and there is no direct way to download it, web scraping using Python is a skill you can use to extract the data into a useful form that can be imported.

In this tutorial, you will learn about the following:

• Data extraction from the web using Python's Beautiful Soup module

• Data manipulation and cleaning using Python's Pandas library

• Data visualization using Python's Matplotlib library

The dataset used in this tutorial was taken from a 10K race that took place in Hillsboro, OR on June 2017. Specifically, you will analyze the performance of the 10K runners and answer questions such as:

• What was the average finish time for the runners?

• Did the runners' finish times follow a normal distribution?

• Were there any performance differences between males and females of various age groups?

Web Scraping using Beautiful Soup

Using Jupyter Notebook, you should start by importing the necessary modules (pandas, numpy, matplotlib.pyplot, seaborn). If you don't have Jupyter Notebook installed, I recommend installing it using the Anaconda Python distribution which is available on the internet. To easily display the plots, make sure to include the line %matplotlib inline as shown below.

import pandas as pd
import numpy as np
import matplotlib.pyplot as plt
import seaborn as sns
%matplotlib inline

To perform web scraping, you should also import the libraries shown below. The urllib.request module is used to open URLs. The Beautiful Soup package is used to extract data from html files. The Beautiful Soup library's name is bs4 which stands for Beautiful Soup, version 4.

from urllib.request import urlopen
from bs4 import BeautifulSoup

After importing necessary modules, you should specify the URL containing the dataset and pass it to urlopen() to get the html of the page.

url = "http://www.hubertiming.com/results/2017GPTR10K"
html = urlopen(url)

Getting the html of the page is just the first step. Next step is to create a Beautiful Soup object from the html. This is done by passing the html to the BeautifulSoup() function. The Beautiful Soup package is used to parse the html, that is, take the raw html text and break it into Python objects. The second argument 'lxml' is the html parser whose details you do not need to worry about at this point.

soup = BeautifulSoup(html, 'lxml')
type(soup)
bs4.BeautifulSoup

The soup object allows you to extract interesting information about the website you're scraping such as getting the title of the page as shown below.

# Get the title
title = soup.title
print(title)
<title>2017 Intel Great Place to Run 10K \ Urban Clash Games Race Results</title>

You can also get the text of the webpage and quickly print it out to check if it is what you expect.

# Print out the text
text = soup.get_text()
#print(soup.text)

You can view the html of the webpage by right-clicking anywhere on the webpage and selecting "Inspect." This is what the result looks like.

You can use the find_all() method of soup to extract useful html tags within a webpage. Examples of useful tags include < a > for hyperlinks, < table > for tables, < tr > for table rows, < th > for table headers, and < td > for table cells. The code below shows how to extract all the hyperlinks within the webpage.

soup.find_all('a')
[<a class="btn btn-primary btn-lg" href="/results/2017GPTR" role="button">5K</a>,
 <a href="http://hubertiming.com/">Huber Timing Home</a>,
 <a href="#individual">Individual Results</a>,
 <a href="#team">Team Results</a>,
 <a href="mailto:timing@hubertiming.com">timing@hubertiming.com</a>,
 <a href="#tabs-1" style="font-size: 18px">Results</a>,
 <a name="individual"></a>,
 <a name="team"></a>,
 <a href="http://www.hubertiming.com/"><img height="65" src="/sites/all/themes/hubertiming/images/clockWithFinishSign_small.png" width="50"/>Huber Timing</a>,
 <a href="http://facebook.com/hubertiming/"><img src="/results/FB-f-Logo__blue_50.png"/></a>]

As you can see from the output above, html tags sometimes come with attributes such as class, src, etc. These attributes provide additional information about html elements. You can use a for loop and the get('"href") method to extract and print out only hyperlinks.

all_links = soup.find_all("a")
for link in all_links:
    print(link.get("href"))
/results/2017GPTR
http://hubertiming.com/
#individual
#team
mailto:timing@hubertiming.com
#tabs-1
None
None
http://www.hubertiming.com/
http://facebook.com/hubertiming/

To print out table rows only, pass the 'tr' argument in soup.find_all().

# Print the first 10 rows for sanity check
rows = soup.find_all('tr')
print(rows[:10])
[<tr><td>Finishers:</td><td>577</td></tr>, <tr><td>Male:</td><td>414</td></tr>, <tr><td>Female:</td><td>163</td></tr>, <tr class="header">
<th>Place</th>
<th>Bib</th>
<th>Name</th>
<th>Gender</th>
<th>City</th>
<th>State</th>
<th>Chip Time</th>
<th>Chip Pace</th>
<th>Gender Place</th>
<th>Age Group</th>
<th>Age Group Place</th>
<th>Time to Start</th>
<th>Gun Time</th>
<th>Team</th>
</tr>, <tr>
<td>1</td>
<td>814</td>
<td>JARED WILSON</td>
<td>M</td>
<td>TIGARD</td>
<td>OR</td>
<td>00:36:21</td>
<td>05:51</td>
<td>1 of 414</td>
<td>M 36-45</td>
<td>1 of 152</td>
<td>00:00:03</td>
<td>00:36:24</td>
<td></td>
</tr>, <tr>
<td>2</td>
<td>573</td>
<td>NATHAN A SUSTERSIC</td>
<td>M</td>
<td>PORTLAND</td>
<td>OR</td>
<td>00:36:42</td>
<td>05:55</td>
<td>2 of 414</td>
<td>M 26-35</td>
<td>1 of 154</td>
<td>00:00:03</td>
<td>00:36:45</td>
<td>INTEL TEAM F</td>
</tr>, <tr>
<td>3</td>
<td>687</td>
<td>FRANCISCO MAYA</td>
<td>M</td>
<td>PORTLAND</td>
<td>OR</td>
<td>00:37:44</td>
<td>06:05</td>
<td>3 of 414</td>
<td>M 46-55</td>
<td>1 of 64</td>
<td>00:00:04</td>
<td>00:37:48</td>
<td></td>
</tr>, <tr>
<td>4</td>
<td>623</td>
<td>PAUL MORROW</td>
<td>M</td>
<td>BEAVERTON</td>
<td>OR</td>
<td>00:38:34</td>
<td>06:13</td>
<td>4 of 414</td>
<td>M 36-45</td>
<td>2 of 152</td>
<td>00:00:03</td>
<td>00:38:37</td>
<td></td>
</tr>, <tr>
<td>5</td>
<td>569</td>
<td>DEREK G OSBORNE</td>
<td>M</td>
<td>HILLSBORO</td>
<td>OR</td>
<td>00:39:21</td>
<td>06:20</td>
<td>5 of 414</td>
<td>M 26-35</td>
<td>2 of 154</td>
<td>00:00:03</td>
<td>00:39:24</td>
<td>INTEL TEAM F</td>
</tr>, <tr>
<td>6</td>
<td>642</td>
<td>JONATHON TRAN</td>
<td>M</td>
<td>PORTLAND</td>
<td>OR</td>
<td>00:39:49</td>
<td>06:25</td>
<td>6 of 414</td>
<td>M 18-25</td>
<td>1 of 34</td>
<td>00:00:06</td>
<td>00:39:55</td>
<td></td>
</tr>]

The goal of this tutorial is to take a table from a webpage and convert it into a dataframe for easier manipulation using Python. To get there, you should get all table rows in list form first and then convert that list into a dataframe. Below is a for loop that iterates through table rows and prints out the cells of the rows.

for row in rows:
    row_td = row.find_all('td')
print(row_td)
type(row_td)
[<td>14TH</td>, <td>INTEL TEAM M</td>, <td>04:43:23</td>, <td>00:58:59 - DANIELLE CASILLAS</td>, <td>01:02:06 - RAMYA MERUVA</td>, <td>01:17:06 - PALLAVI J SHINDE</td>, <td>01:25:11 - NALINI MURARI</td>]


bs4.element.ResultSet

The output above shows that each row is printed with html tags embedded in each row. This is not what you want. You can use remove the html tags using Beautiful Soup or regular expressions.

The easiest way to remove html tags is to use Beautiful Soup, and it takes just one line of code to do this. Pass the string of interest into BeautifulSoup() and use the get_text() method to extract the text without html tags.

str_cells = str(row_td)
cleantext = BeautifulSoup(str_cells, "lxml").get_text()
print(cleantext)
[14TH, INTEL TEAM M, 04:43:23, 00:58:59 - DANIELLE CASILLAS, 01:02:06 - RAMYA MERUVA, 01:17:06 - PALLAVI J SHINDE, 01:25:11 - NALINI MURARI]

Using regular expressions is highly discouraged since it requires several lines of code and one can easily make mistakes. It requires importing the re (for regular expressions) module. The code below shows how to build a regular expression that finds all the characters inside the < td > html tags and replace them with an empty string for each table row. First, you compile a regular expression by passing a string to match to re.compile(). The dot, star, and question mark (.*?) will match an opening angle bracket followed by anything and followed by a closing angle bracket. It matches text in a non-greedy fashion, that is, it matches the shortest possible string. If you omit the question mark, it will match all the text between the first opening angle bracket and the last closing angle bracket. After compiling a regular expression, you can use the re.sub() method to find all the substrings where the regular expression matches and replace them with an empty string. The full code below generates an empty list, extract text in between html tags for each row, and append it to the assigned list.

import re

list_rows = []
for row in rows:
    cells = row.find_all('td')
    str_cells = str(cells)
    clean = re.compile('<.*?>')
    clean2 = (re.sub(clean, '',str_cells))
    list_rows.append(clean2)
print(clean2)
type(clean2)
[14TH, INTEL TEAM M, 04:43:23, 00:58:59 - DANIELLE CASILLAS, 01:02:06 - RAMYA MERUVA, 01:17:06 - PALLAVI J SHINDE, 01:25:11 - NALINI MURARI]


str

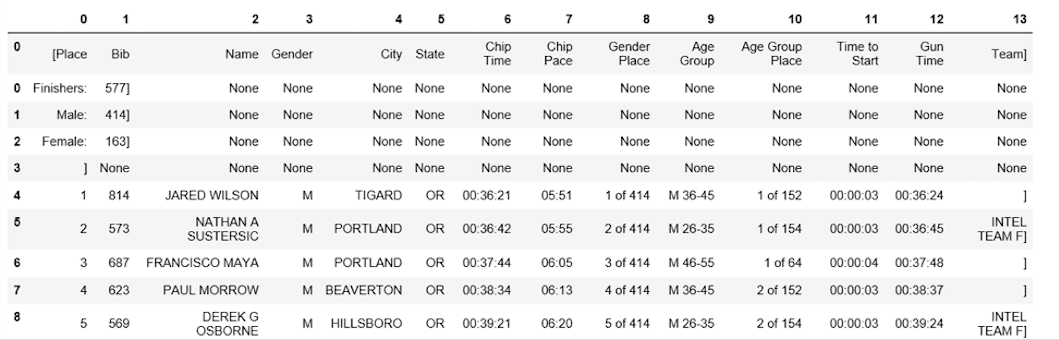
The next step is to convert the list into a dataframe and get a quick view of the first 10 rows using Pandas.

df = pd.DataFrame(list_rows)
df.head(10)

0

0

[Finishers:, 577]

1

[Male:, 414]

2

[Female:, 163]

3

[]

4

[1, 814, JARED WILSON, M, TIGARD, OR, 00:36:21...

5

[2, 573, NATHAN A SUSTERSIC, M, PORTLAND, OR, ...

6

[3, 687, FRANCISCO MAYA, M, PORTLAND, OR, 00:3...

7

[4, 623, PAUL MORROW, M, BEAVERTON, OR, 00:38:...

8

[5, 569, DEREK G OSBORNE, M, HILLSBORO, OR, 00...

9

[6, 642, JONATHON TRAN, M, PORTLAND, OR, 00:39...

Data Manipulation and Cleaning

The dataframe is not in the format we want. To clean it up, you should split the "0" column into multiple columns at the comma position. This is accomplished by using the str.split() method.

df1 = df[0].str.split(',', expand=True)
df1.head(10)

This looks much better, but there is still work to do. The dataframe has unwanted square brackets surrounding each row. You can use the strip() method to remove the opening square bracket on column "0."

df1[0] = df1[0].str.strip('[')
df1.head(10)

The table is missing table headers. You can use the find_all() method to get the table headers.

col_labels = soup.find_all('th')

Similar to table rows, you can use Beautiful Soup to extract text in between html tags for table headers.

all_header = []
col_str = str(col_labels)
cleantext2 = BeautifulSoup(col_str, "lxml").get_text()
all_header.append(cleantext2)
print(all_header)
['[Place, Bib, Name, Gender, City, State, Chip Time, Chip Pace, Gender Place, Age Group, Age Group Place, Time to Start, Gun Time, Team]']

You can then convert the list of headers into a pandas dataframe.

df2 = pd.DataFrame(all_header)
df2.head()

0

0

[Place, Bib, Name, Gender, City, State, Chip T...

Similarly, you can split column "0" into multiple columns at the comma position for all rows.

df3 = df2[0].str.split(',', expand=True)
df3.head()

The two dataframes can be concatenated into one using the concat() method as illustrated below.

frames = [df3, df1]

df4 = pd.concat(frames)
df4.head(10)

Below shows how to assign the first row to be the table header.

df5 = df4.rename(columns=df4.iloc[0])
df5.head()

At this point, the table is almost properly formatted. For analysis, you can start by getting an overview of the data as shown below.

df5.info()
df5.shape
<class 'pandas.core.frame.DataFrame'>
Int64Index: 597 entries, 0 to 595
Data columns (total 14 columns):
[Place              597 non-null object
 Bib                596 non-null object
 Name               593 non-null object
 Gender             593 non-null object
 City               593 non-null object
 State              593 non-null object
 Chip Time          593 non-null object
 Chip Pace          578 non-null object
 Gender Place       578 non-null object
 Age Group          578 non-null object
 Age Group Place    578 non-null object
 Time to Start      578 non-null object
 Gun Time           578 non-null object
 Team]              578 non-null object
dtypes: object(14)
memory usage: 70.0+ KB


(597, 14)

The table has 597 rows and 14 columns. You can drop all rows with any missing values.

df6 = df5.dropna(axis=0, how='any')

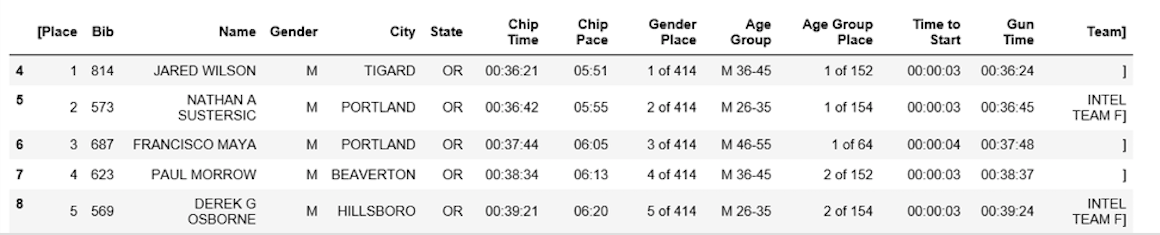
Also, notice how the table header is replicated as the first row in df5. It can be dropped using the following line of code.

df7 = df6.drop(df6.index[0])
df7.head()

You can perform more data cleaning by renaming the '[Place' and ' Team]' columns. Python is very picky about space. Make sure you include space after the quotation mark in ' Team]'.

df7.rename(columns={'[Place': 'Place'},inplace=True)
df7.rename(columns={' Team]': 'Team'},inplace=True)
df7.head()

The final data cleaning step involves removing the closing bracket for cells in the "Team" column.

df7['Team'] = df7['Team'].str.strip(']')
df7.head()

It took a while to get here, but at this point, the dataframe is in the desired format. Now you can move on to the exciting part and start plotting the data and computing interesting statistics.

Data Analysis and Visualization

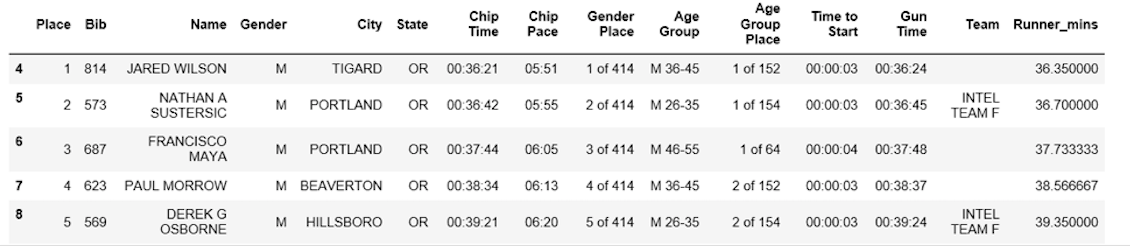
The first question to answer is, what was the average finish time (in minutes) for the runners? You need to convert the column "Chip Time" into just minutes. One way to do this is to convert the column to a list first for manipulation.

time_list = df7[' Chip Time'].tolist()

# You can use a for loop to convert 'Chip Time' to minutes

time_mins = []
for i in time_list:
    h, m, s = i.split(':')
    math = (int(h) * 3600 + int(m) * 60 + int(s))/60
    time_mins.append(math)
#print(time_mins)

The next step is to convert the list back into a dataframe and make a new column ("Runner_mins") for runner chip times expressed in just minutes.

df7['Runner_mins'] = time_mins
df7.head()

The code below shows how to calculate statistics for numeric columns only in the dataframe.

df7.describe(include=[np.number])

Runner_mins

count

577.000000

mean

60.035933

std

11.970623

min

36.350000

25%

51.000000

50%

59.016667

75%

67.266667

max

101.300000

Interestingly, the average chip time for all runners was ~60 mins. The fastest 10K runner finished in 36.35 mins, and the slowest runner finished in 101.30 minutes.

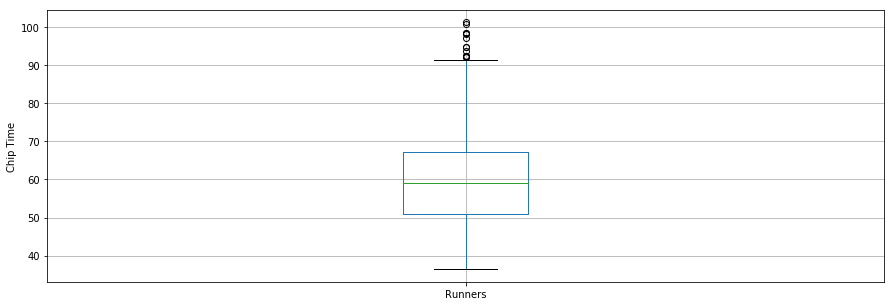
A boxplot is another useful tool to visualize summary statistics (maximum, minimum, medium, first quartile, third quartile, including outliers). Below are data summary statistics for the runners shown in a boxplot. For data visualization, it is convenient to first import parameters from the pylab module that comes with matplotlib and set the same size for all figures to avoid doing it for each figure.

from pylab import rcParams
rcParams['figure.figsize'] = 15, 5
df7.boxplot(column='Runner_mins')
plt.grid(True, axis='y')
plt.ylabel('Chip Time')
plt.xticks([1], ['Runners'])
([<matplotlib.axis.XTick at 0x570dd106d8>],
 <a list of 1 Text xticklabel objects>)

The second question to answer is: Did the runners' finish times follow a normal distribution?

Below is a distribution plot of runners' chip times plotted using the seaborn library. The distribution looks almost normal.

x = df7['Runner_mins']
ax = sns.distplot(x, hist=True, kde=True, rug=False, color='m', bins=25, hist_kws={'edgecolor':'black'})
plt.show()

The third question deals with whether there were any performance differences between males and females of various age groups. Below is a distribution plot of chip times for males and females.

f_fuko = df7.loc[df7[' Gender']==' F']['Runner_mins']
m_fuko = df7.loc[df7[' Gender']==' M']['Runner_mins']
sns.distplot(f_fuko, hist=True, kde=True, rug=False, hist_kws={'edgecolor':'black'}, label='Female')
sns.distplot(m_fuko, hist=False, kde=True, rug=False, hist_kws={'edgecolor':'black'}, label='Male')
plt.legend()
<matplotlib.legend.Legend at 0x570e301fd0>

The distribution indicates that females were slower than males on average. You can use the groupby() method to compute summary statistics for males and females separately as shown below.

g_stats = df7.groupby(" Gender", as_index=True).describe()
print(g_stats)
        Runner_mins                                                         \
              count       mean        std        min        25%        50%   
 Gender                                                                      
 F            163.0  66.119223  12.184440  43.766667  58.758333  64.616667   
 M            414.0  57.640821  11.011857  36.350000  49.395833  55.791667   


               75%         max  
 Gender                         
 F       72.058333  101.300000  
 M       64.804167   98.516667  

The average chip time for all females and males was ~66 mins and ~58 mins, respectively. Below is a side-by-side boxplot comparison of male and female finish times.

df7.boxplot(column='Runner_mins', by=' Gender')
plt.ylabel('Chip Time')
plt.suptitle("")
C:\Users\smasango\AppData\Local\Continuum\anaconda3\lib\site-packages\numpy\core\fromnumeric.py:57: FutureWarning: reshape is deprecated and will raise in a subsequent release. Please use .values.reshape(...) instead
  return getattr(obj, method)(*args, **kwds)


Text(0.5,0.98,'')

Conclusion

In this tutorial, you performed web scraping using Python. You used the Beautiful Soup library to parse html data and convert it into a form that can be used for analysis. You performed cleaning of the data in Python and created useful plots (box plots, bar plots, and distribution plots) to reveal interesting trends using Python's matplotlib and seaborn libraries. After this tutorial, you should be able to use Python to easily scrape data from the web, apply cleaning techniques and extract useful insights from the data.

Reference :

https://www.datacamp.com