# Create Auto-Updating Excel of Stock Market
## How to Create Auto-Updating Excel Spreadsheets of Stock Market Data with Python, AWS, and IEX Cloud

Many Python developers in the financial world are tasked with creating Excel documents for analysis by non-technical users.
This is actually a lot harder than it sounds. From sourcing the data to formatting the spreadsheet to deploying the final doc in a central location, there are plenty of steps involved in the process.
In this tutorial, I'm going to show you how to create Excel spreadsheets using Python that:
* Use stock market data from IEX Cloud
* Are deployed in a centralized S3 bucket so that anyone with the right URL can access them
* Automatically update daily using the `cron` command line utility
### Step 1: Create an Account with IEX Cloud
[IEX Cloud](https://iexcloud.io/) is the data provider subsidiary of the [IEX stock exchange](https://iextrading.com/).
In case you're unfamiliar with IEX, it is an acronym for "The Investor's Exchange". IEX was founded by Brad Katsuyama to build a better stock exchange that avoids investor-unfriendly behavior like front-running and high-frequency trading. Katsuyama's exploits were famously chronicled in Michael Lewis' best-selling book [Flash Boys](https://en.wikipedia.org/wiki/Flash_Boys).
I have investigated many financial data providers and IEX Cloud has the best combination of:
* High-quality data
* Affordable price
Their prices are below: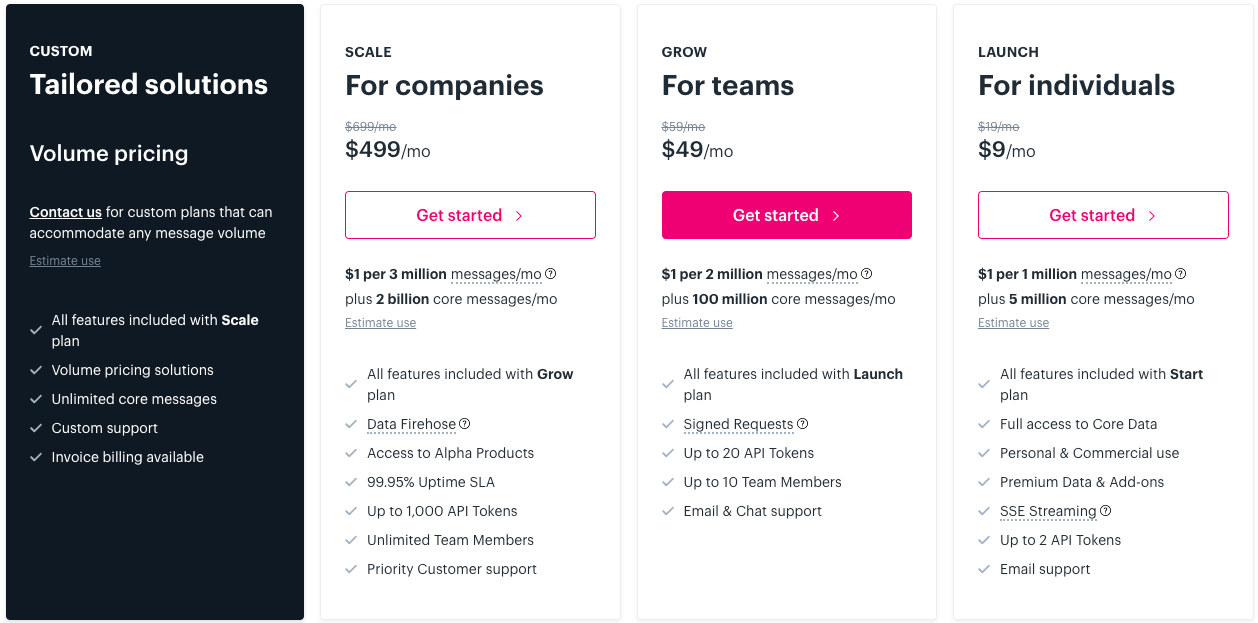
The $9/month **Launch** plan is plenty for many use cases.
**A warning on using IEX Cloud (and any other pay-per-use data provider):** it is very important that you set usage budgets from the beginning. These budgets lock you out of your account once you hit a certain dollar cost for the month.
When I first started using IEX Cloud, I accidentally created an infinite loop on a Friday afternoon that contained an API call to IEX Cloud. These API calls are priced on a cost-per-call basis...which resulted in a terrifying email from IEX: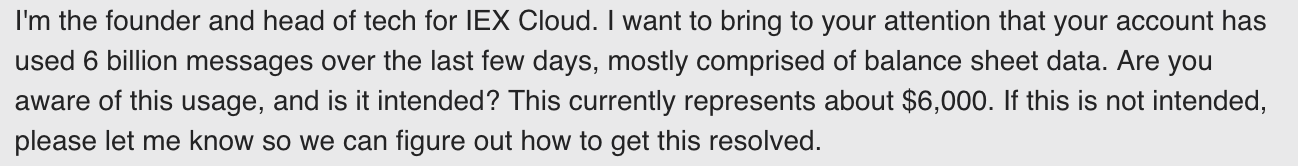
It is a testament to IEX's customer-centricity that they agreed to reset my usage as long as I set usage budgets moving forward. Go IEX!
As with most API subscriptions, the main benefit of creating an IEX Cloud account is having an API key.
For obvious reasons, I will not share an API key in this article.
However, you can still work through this tutorial with your own API key as long as you assign it to the following variable name:
```
IEX_API_Key
```
You will see the blank `IEX_API_Key` variable in my code blocks throughout the rest of this tutorial.
### Step 2: Write Your Python Script
Now that you have access to the API key that you'll need to gather financial data, it's time to write your Python script.
This will be the longest section of this tutorial. It is also the most flexible - we are going to create a Python script that satisfies certain pre-specified criteria, but you could modify this section to really create any spreadsheet you want!
To start, let's lay out our goal posts. We are going to write a Python script that generates an Excel file of stock market data with the following characteristics:
* It will include the 10 largest stocks in the United States
* It will contain four columns: stock ticker, company name, share price, and dividend yield.
* It will be formatted such that the header's background color is `#135485` and text is white, while the spreadsheet body's background is `#DADADA` and the font color is black (the default).
Let's start by importing our first package.
Since spreadsheets are essentially just data structures with rows and columns, then the `pandas` library - including its built-in `DataFrame` object - is a perfect candidate for manipulating data in this tutorial.
We'll start by importing `pandas` under the alias `pd` like this:
```
import pandas as pd
```
Next, we'll specify our IEX Cloud API key. As I mentioned before, I'm not going to really include my API key, so you'll have to grab your own API key from your IEX account and include it here:
```
IEX_API_Key = ''
```
Our next step is to determine the ten largest companies in the United States.
You can answer this question with a quick Google search.
For brevity, I have included the companies (or rather, their stock tickers) in the following Python list:
```
tickers = [
'MSFT',
'AAPL',
'AMZN',
'GOOG',
'FB',
'BRK.B',
'JNJ',
'WMT',
'V',
'PG'
]
```
These are the largest 10 companies in the United States based on market capitalization. Note that the actual list of top 10 companies will change over time. This list is current as of mid-April 2020.
Next, it is time to figure out how to ping the IEX Cloud API to pull in the metrics we need for each company.
The IEX Cloud API returns JSON objects in response to HTTP requests. Since we are working with more than 1 ticker in this tutorial, we will use IEX Cloud's batch API call functionality, which allows you to request data on more than one ticker at a time. Using batch API calls has two benefits:
* It reduces the number of HTTP requests you need to make, which will make your code more performant.
* The pricing for batch API calls is slightly better with most data providers.
Here is an example of what the HTTP request might look like, with a few placeholder words where we'll need to customize the request:
```
https://cloud.iexapis.com/stable/stock/market/batch?symbols=TICKERS&types=ENDPOINTS&range=RANGE&token=IEX_API_Key
```
In this URL, we'll replace these variables with the following values:
* `TICKERS` will be replaced by a string that contains each of our tickers separated by a comma.
* `ENDPOINTS` will be replaced by a string that contains each of the IEX Cloud endpoints we want to hit, separated by a comma.
* `RANGE` will be replaced by `1y`. These endpoints each contain point-in-time data and not time series data, so this range can really be whatever you want.
Let's put this URL into a variable called `HTTP_request` for us to modify later:
```
HTTP_request = 'https://cloud.iexapis.com/stable/stock/market/batch?symbols=TICKERS&types=ENDPOINTS&range=RANGE&token=IEX_API_Key'
```
Let's work through each of these variables one-by-one to determine the exact URL that we need to hit.
For the `TICKERS` variable, we can generate a real Python variable (and not just a placeholder word) with a simple `for` loop:
```
#Create an empty string called `ticker_string` that we'll add tickers and commas to
ticker_string = ''
#Loop through every element of `tickers` and add them and a comma to ticker_string
for ticker in tickers:
ticker_string += ticker
ticker_string += ','
#Drop the last comma from `ticker_string`
ticker_string = ticker_string[:-1]
```
Now we can interpolate our `ticker_string` variable into the `HTTP_request` variable that we created earlier using an f-string:
```
HTTP_request = f'https://cloud.iexapis.com/stable/stock/market/batch?symbols={ticker_string}&types=ENDPOINTS&range=RANGE&token=IEX_API_Key'
```
Next, we need to determine which IEX Cloud endpoints we need to ping.
Some quick investigation into the IEX Cloud documentation reveals that we only need the `price` and `stats` endpoints to create our spreadsheet.
Thus, we can replace the placeholder `ENDPOINTS` word from our original HTTP request with the following variable:
```
endpoints = 'price,stats'
```
Like we did with our `ticker_string` variable, let's substitute the `endpoints` variable into the `ticker_string` variable:
```
HTTP_request = f'https://cloud.iexapis.com/stable/stock/market/batch?symbols={ticker_string}&types={endpoints}&range=RANGE&token=IEX_API_Key'
```
The last placeholder we need to replace is `RANGE`. We will not replace with this a variable. Instead, we can hardcode a `1y` directly into the URL path like this:
```
https://cloud.iexapis.com/stable/stock/market/batch?symbols={ticker_string}&types={endpoints}&range=1y&token=IEX_API_Key
```
We've done a lot so far, so let's recap our code base:
```
import pandas as pd
IEX_API_Key = ''
#Specify the stock tickers that will be included in our spreadsheet
tickers = [
'MSFT',
'AAPL',
'AMZN',
'GOOG',
'FB',
'BRK.B',
'JNJ',
'WMT',
'V',
'PG'
]
#Create an empty string called `ticker_string` that we'll add tickers and commas to
ticker_string = ''
#Loop through every element of `tickers` and add them and a comma to ticker_string
for ticker in tickers:
ticker_string += ticker
ticker_string += ','
#Drop the last comma from `ticker_string`
ticker_string = ticker_string[:-1]
#Create the endpoint strings
endpoints = 'price,stats'
#Interpolate the endpoint strings into the HTTP_request string
HTTP_request = f'https://cloud.iexapis.com/stable/stock/market/batch?symbols={ticker_string}&types={endpoints}&range=1y&token={IEX_API_Key}'
```
It is now time to ping the API and save its data into a data structure within our Python application.
We can read JSON objects with pandas' `read_json` method. In our case, we'll save the JSON data to a `pandas DataFrame` called `raw_data`, like this:
```
raw_data = pd.read_json(HTTP_request)
```
Let's take a moment now to make sure that the data has been imported in a nice format for our application.
If you're working through this tutorial in a [Jupyter Notebook](https://jupyter.org/), you can simply type the name of the `pandas DataFrame` variable on the last line of a code cell, and Jupyter will nicely render an image of the data, like this: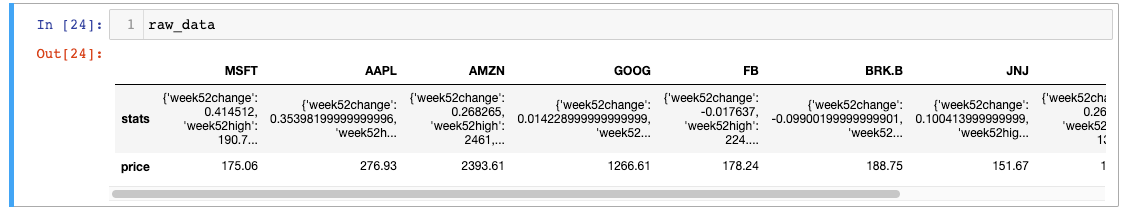
As you can see, the `pandas DataFrame` contains a column for each stock ticker and two rows: one for the `stats` endpoint and one for the `price` endpoint. We will need to parse this DataFrame to get the four metrics we want. Let's work through the metrics one-by-one in the steps below.
#### Metric 1: Stock Ticker
This step is very straightforward since the stock tickers are contained in the columns of the `pandas DataFrame`. We can access them through the `columns` attribute of the `pandas DataFrame` like this:
```
raw_data.columns
```
To access the other metrics in `raw_data`, we will create a `for` loop that loops through each ticker in `raw_data.columns`. In each iteration of the loop we will add the data to a new `pandas DataFrame` object called `output_data`.
First we'll need to create `output_data`, which should be an empty `pandas DataFrame` with four columns. Here's how to do this:
```
output_data = pd.DataFrame(pd.np.empty((0,4)))
```
This creates an empty `pandas DataFrame` with 0 rows and 4 columns.
Now that this object has been created, here's how we can structure this `for` loop:
```
for ticker in raw_data.columns:
#Parse the company's name - not completed yet
company_name = ''
#Parse the company's stock price - not completed yet
stock_price = 0
#Parse the company's dividend yield - not completed yet
dividend_yield = 0
new_column = pd.Series([ticker, company_name, stock_price, dividend_yield])
output_data = output_data.append(new_column, ignore_index = True)
```
Next, let's determine how to parse the `company_name` variable from the `raw_data` object.
#### Metric 2: Company Name
The `company_name` variable is the first variable will need to be parsed from the `raw_data` object. As a quick recap, here's what `raw_data` looks like: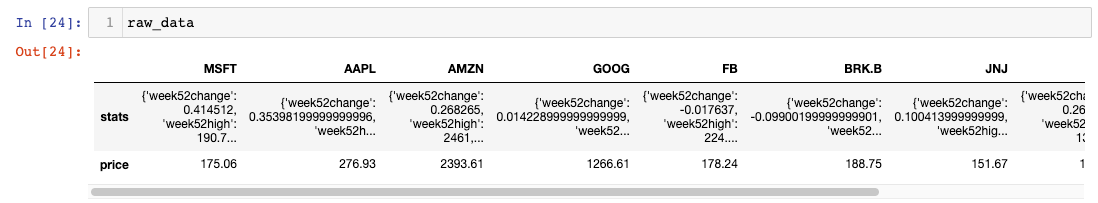
The `company_name` variable is held within the `stats` endpoint under the dictionary key `companyName`. To parse this data point out of `raw_data`, we can use these indexes:
```
raw_data[ticker]['stats']['companyName']
```
Including this in our `for` loop from before gives this:
```
output_data = pd.DataFrame(pd.np.empty((0,4)))
for ticker in raw_data.columns:
#Parse the company's name - not completed yet
company_name = raw_data[ticker]['stats']['companyName']
#Parse the company's stock price - not completed yet
stock_price = 0
#Parse the company's dividend yield - not completed yet
dividend_yield = 0
new_column = pd.Series([ticker, company_name, stock_price, dividend_yield])
output_data = output_data.append(new_column, ignore_index = True)
```
Let's move on to parsing `stock_price`.
#### Metric 3: Stock Price
The `stock_price` variable is contained within the `price` endpoint, which returns only a single value. This means we do not need to chain together indexes like we did with `company_name`.
Here's how we could parse `stock_price` from `raw_data`:
```
raw_data[ticker]['price']
```
Including this in our `for` loop gives us:
```
output_data = pd.DataFrame(pd.np.empty((0,4)))
for ticker in raw_data.columns:
#Parse the company's name - not completed yet
company_name = raw_data[ticker]['stats']['companyName']
#Parse the company's stock price - not completed yet
stock_price = raw_data[ticker]['price']
#Parse the company's dividend yield - not completed yet
dividend_yield = 0
new_column = pd.Series([ticker, company_name, stock_price, dividend_yield])
output_data = output_data.append(new_column, ignore_index = True)
```
The last metric we need to parse is `dividend_yield`.
#### Metric 4: Dividend Yield
Like `company_name`, `dividend_yield` is contained in the `stats` endpoint. It is held under the `dividendYield` dictionary key.
Here is how we could parse it out of `raw_data`:
```
raw_data[ticker]['stats']['dividendYield']
```
Adding this to our `for` loop gives us:
```
output_data = pd.DataFrame(pd.np.empty((0,4)))
for ticker in raw_data.columns:
#Parse the company's name - not completed yet
company_name = raw_data[ticker]['stats']['companyName']
#Parse the company's stock price - not completed yet
stock_price = raw_data[ticker]['price']
#Parse the company's dividend yield - not completed yet
dividend_yield = raw_data[ticker]['stats']['dividendYield']
new_column = pd.Series([ticker, company_name, stock_price, dividend_yield])
output_data = output_data.append(new_column, ignore_index = True)
```
Let's print out our `output_data` object to see what the data looks like: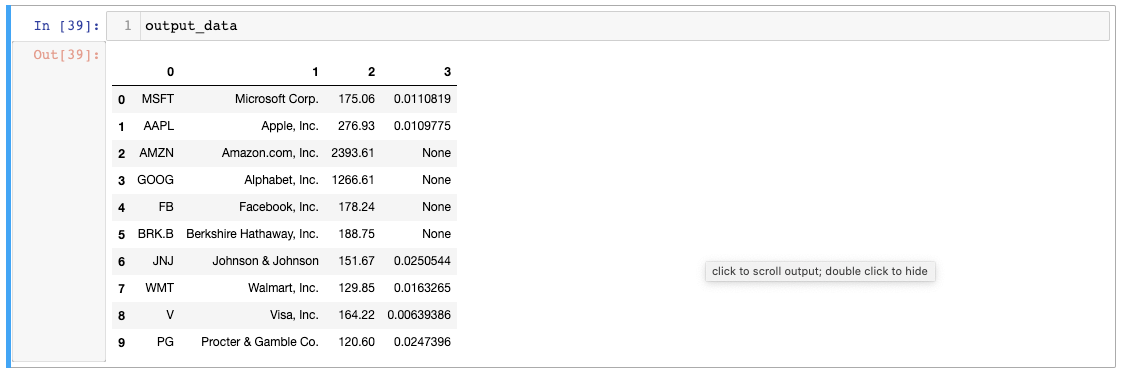
So far so good! The next two steps are to name the columns of the `pandas DataFrame` and to change its index.
#### How to Name the Columns of a Pandas DataFrame
We can update the column names of our `output_data` object by creating a list of column names and assigning it to the `output_data.columns` attribute, like this:
```
output_data.columns = ['Ticker', 'Company Name', 'Stock Price', 'Dividend Yield']
```
Let's print out our `output_data` object to see what the data looks like: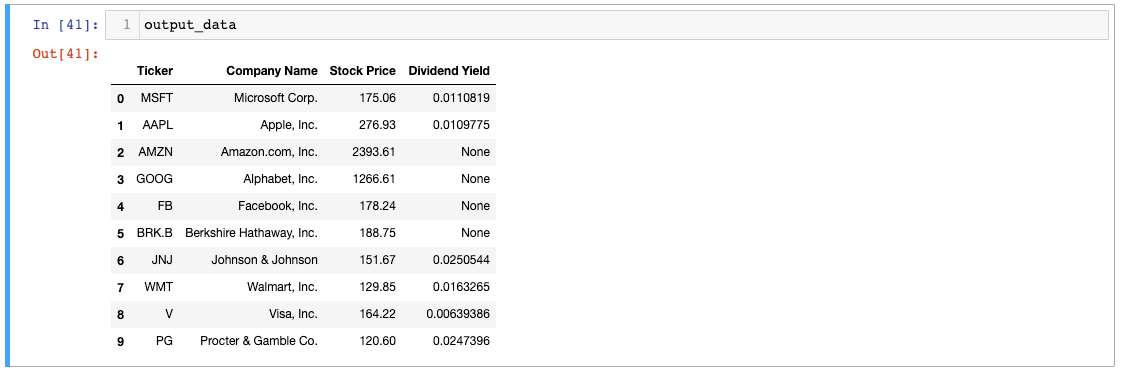
Much better! Let's change the index of `output_data` next.
#### How to Change the Index of a Pandas DataFrame
The index of a `pandas DataFrame` is a special column that is somewhat similar to the primary key of a SQL database table. In our `output_data` object, we want to set the `Ticker` column as the `DataFrame`'s index.
Here's how we can do this using the `set_index` method:
```
output_data.set_index('Ticker', inplace=True)
```
Let's print out our `output_data` object to see what the data looks like: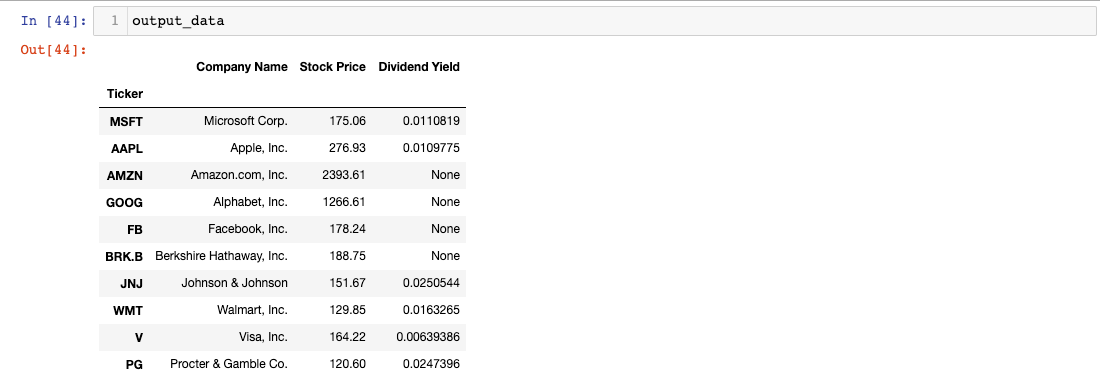
Another incremental improvement!
Next, let's deal with the missing data in `output_data`.
#### How to Handle Missing Data in Pandas DataFrames
If you take a close look at `output_data`, you will notice that there are several `None` values in the `Dividend Yield` column:
These `None` values simply indicate that the company for that row does not currently pay a dividend. While `None` is one way of representing a non-dividend stock, it is more common to show a `Dividend Yield` of `0`.
Fortunately, the fix for this is quite straightforward. The `pandas` library includes an excellent `fillna` method that allows us to replace missing values in a `pandas DataFrame`.
Here's how we can use the `fillna` method to replace our `Dividend Yield` column's `None` values with `0`:
```
output_data['Dividend Yield'].fillna(0,inplace=True)
```
The `output_data` object looks much cleaner now: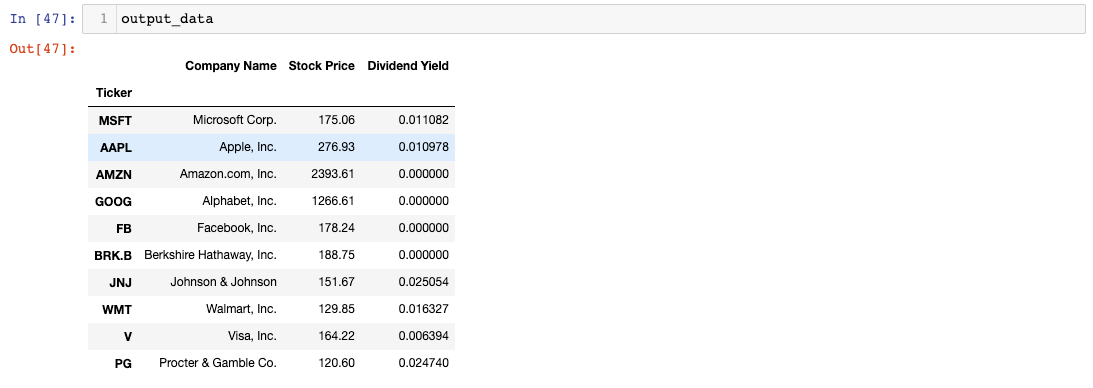
We are now ready to export our DataFrame to an Excel document! As a quick recap, here is our Python script to date:
```
import pandas as pd
IEX_API_Key = ''
#Specify the stock tickers that will be included in our spreadsheet
tickers = [
'MSFT',
'AAPL',
'AMZN',
'GOOG',
'FB',
'BRK.B',
'JNJ',
'WMT',
'V',
'PG'
]
#Create an empty string called `ticker_string` that we'll add tickers and commas to
ticker_string = ''
#Loop through every element of `tickers` and add them and a comma to ticker_string
for ticker in tickers:
ticker_string += ticker
ticker_string += ','
#Drop the last comma from `ticker_string`
ticker_string = ticker_string[:-1]
#Create the endpoint strings
endpoints = 'price,stats'
#Interpolate the endpoint strings into the HTTP_request string
HTTP_request = f'https://cloud.iexapis.com/stable/stock/market/batch?symbols={ticker_string}&types={endpoints}&range=1y&token={IEX_API_Key}'
#Create an empty pandas DataFrame to append our parsed values into during our for loop
output_data = pd.DataFrame(pd.np.empty((0,4)))
for ticker in raw_data.columns:
#Parse the company's name
company_name = raw_data[ticker]['stats']['companyName']
#Parse the company's stock price
stock_price = raw_data[ticker]['price']
#Parse the company's dividend yield
dividend_yield = raw_data[ticker]['stats']['dividendYield']
new_column = pd.Series([ticker, company_name, stock_price, dividend_yield])
output_data = output_data.append(new_column, ignore_index = True)
#Change the column names of output_data
output_data.columns = ['Ticker', 'Company Name', 'Stock Price', 'Dividend Yield']
#Change the index of output_data
output_data.set_index('Ticker', inplace=True)
#Replace the missing values of the 'Dividend Yield' column with 0
output_data['Dividend Yield'].fillna(0,inplace=True)
#Print the DataFrame
output_data
```
#### How to Export A Styled Excel Document From a Pandas DataFrame using XlsxWriter
There are multiple ways to export an `xlsx` file from a `pandas DataFrame`.
The easiest way is to use the built-in function `to_excel`. As an example, here's how we could export `output_data` to an Excel file:
```
output_data.to_excel('my_excel_document.xlsx)
```
The problem with this approach is that the Excel file has no format whatsoever. The output looks like this: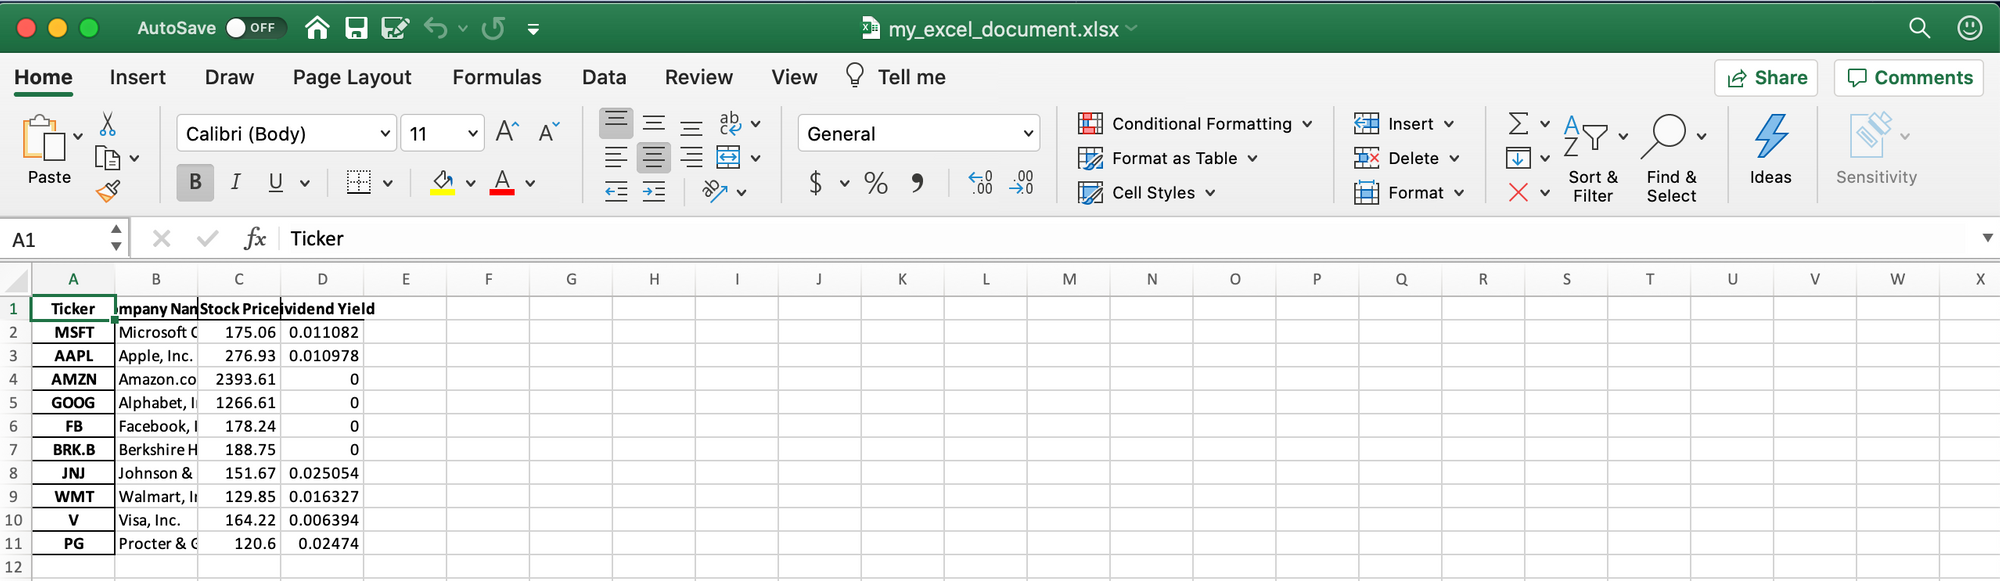
The lack of formatting in this document makes it hard to interpret.
What is the solution?
We can use the Python package `XlsxWriter` to generate nicely-formatted Excel files. To start, we'll want to add the following import to the beginning of our Python script:
```
import xlsxwriter
```
Next, we need to create our actual Excel file. The XlsxWriter package actually has a dedicated documentation page for how to work with `pandas DataFrames`, which is available [here](https://xlsxwriter.readthedocs.io/working_with_pandas.html).
Our first step is to call the `pd.ExcelWriter` function and pass in the desired name of our `xlsx` file as the first argument and `engine='xlsxwriter` as the second argument. We will assign this to a variable called `writer`:
```
writer = pd.ExcelWriter('stock_market_data.xlsx', engine='xlsxwriter')
```
From there, we need to call the `to_excel` method on our `pandas DataFrame`. This time, instead of passing in the name of the file that we're trying to export, we'll pass in the `writer` object that we just created:
```
output_data.to_excel(writer, sheet_name='Sheet1')
```
Lastly, we will call the `save` method on our `writer` object, which saves the `xlsx` file to our current working directory. When all this is done, here is the section of our Python script that saves `output_data` to an Excel file.
```
writer = pd.ExcelWriter('stock_market_data.xlsx', engine='xlsxwriter')
output_data.to_excel(writer, sheet_name='Sheet1')
writer.save()
```
All of the formatting code that we will include in our `xlsx` file needs to be contained between the creation of the `ExcelWriter` object and the `writer.save()` statement.
#### How to Style an `xlsx` File Created with Python
It is actually harder than you might think to style an Excel file using Python.
This is partially because of some of the limitations of the XlsxWriter package. Its documentation states:
> *'XlsxWriter and Pandas provide very little support for formatting the output data from a dataframe apart from default formatting such as the header and index cells and any cells that contain dates or datetimes. In addition it isn’t possible to format any cells that already have a default format applied.*
> *If you require very controlled formatting of the dataframe output then you would probably be better off using Xlsxwriter directly with raw data taken from Pandas. However, some formatting options are available.'*
In my experience, the most flexible way to style cells in an `xlsx` file created by XlsxWriter is to use conditional formatting that only applies styling when a cell is not equal to `None`.
This has three advantages:
1. It provides more styling flexibility than the normal formatting options available in XlsxWriter.
2. You do not need to manually loop through each data point and import them into the `writer` object one-by-one.
3. It allows you to easily see when `None` values have made their way into your finalized `xlsx` files, since they'll be missing the required formatting.
To apply styling using conditional formatting, we first need to create a few style templates. Specifically, we will need four templates:
* One `header_template` that will be applied to the column names at the top of the spreadsheet
* One `string_template` that will be applied to the `Ticker` and `Company Name` columns
* One `dollar_template` that will be applied to the `Stock Price` column
* One `percent_template` that will be applied to the `Dividend Yield` column
Each of these format templates need to be added to the `writer` object in dictionaries that resemble CSS syntax. Here's what I mean:
```
header_template = writer.book.add_format(
{
'font_color': '#ffffff',
'bg_color': '#135485',
'border': 1
}
)
string_template = writer.book.add_format(
{
'bg_color': '#DADADA',
'border': 1
}
)
dollar_template = writer.book.add_format(
{
'num_format':'$0.00',
'bg_color': '#DADADA',
'border': 1
}
)
percent_template = writer.book.add_format(
{
'num_format':'0.0%',
'bg_color': '#DADADA',
'border': 1
}
)
```
To apply these formats to specific cells in our `xlsx` file, we need to call the package's `conditional_format` method on `writer.sheets['Stock Market Data']`. Here is an example:
```
writer.sheets['Stock Market Data'].conditional_format('A2:B11',
{
'type': 'cell',
'criteria': '<>',
'value': '"None"',
'format': string_template
}
)
```
If we generalize this formatting to the other three formats we're applying, here's what the formatting section of our Python script becomes:
```
writer = pd.ExcelWriter('stock_market_data.xlsx', engine='xlsxwriter')
output_data.to_excel(writer, sheet_name='Stock Market Data')
header_template = writer.book.add_format(
{
'font_color': '#ffffff',
'bg_color': '#135485',
'border': 1
}
)
string_template = writer.book.add_format(
{
'bg_color': '#DADADA',
'border': 1
}
)
dollar_template = writer.book.add_format(
{
'num_format':'$0.00',
'bg_color': '#DADADA',
'border': 1
}
)
percent_template = writer.book.add_format(
{
'num_format':'0.0%',
'bg_color': '#DADADA',
'border': 1
}
)
#Format the header of the spreadsheet
writer.sheets['Stock Market Data'].conditional_format('A1:D1',
{
'type': 'cell',
'criteria': '<>',
'value': '"None"',
'format': header_template
}
)
#Format the 'Ticker' and 'Company Name' columns
writer.sheets['Stock Market Data'].conditional_format('A2:B11',
{
'type': 'cell',
'criteria': '<>',
'value': '"None"',
'format': string_template
}
)
#Format the 'Stock Price' column
writer.sheets['Stock Market Data'].conditional_format('C2:C11',
{
'type': 'cell',
'criteria': '<>',
'value': '"None"',
'format': dollar_template
}
)
#Format the 'Dividend Yield' column
writer.sheets['Stock Market Data'].conditional_format('D2:D11',
{
'type': 'cell',
'criteria': '<>',
'value': '"None"',
'format': percent_template
}
)
writer.save()
```
Let's take a look at our Excel document to see how its looking: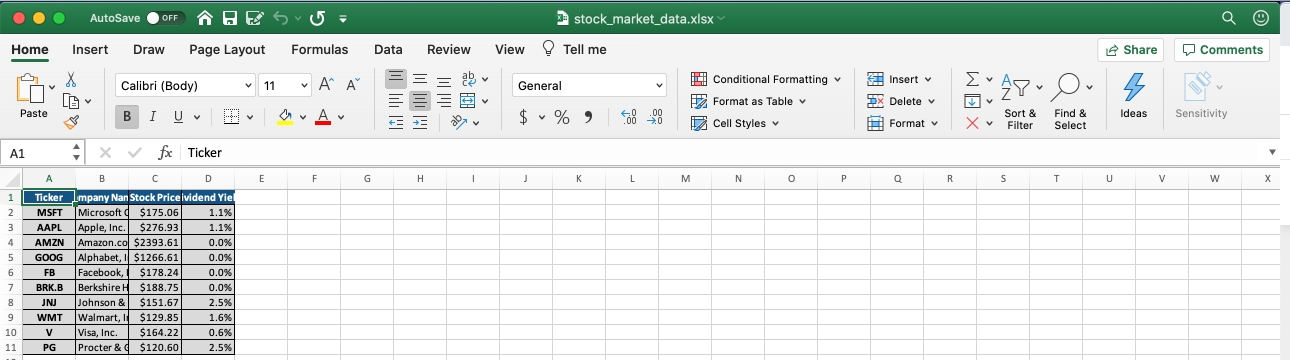
So far so good! The last incremental improvement that we can make to this document is to make its columns a bit wider.
We can specify column widths by calling the `set_column` method on `writer.sheets['Stock Market Data']`.
Here's what we'll add to our Python script to do this:
```
#Specify all column widths
writer.sheets['Stock Market Data'].set_column('B:B', 32)
writer.sheets['Stock Market Data'].set_column('C:C', 18)
writer.sheets['Stock Market Data'].set_column('D:D', 20)
```
Here's the final version of the spreadsheet: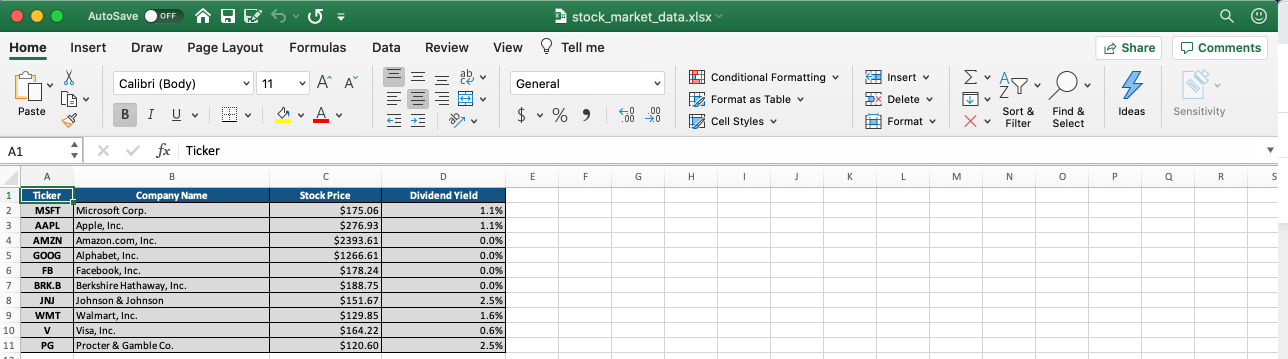
Voila! We are good to go! [You can access the final version of this Python script on GitHub here](https://github.com/nicholasmccullum/freecodecamp-articles). The file is named `stock_market_data.py`.
### Step 3: Set Up an AWS EC2 Virtual Machine to Run Your Python Script
Your Python script is finalized and ready to run.
However, we do not want to simply run this on our local machine on an ad hoc basis.
Instead, we are going to set up a virtual machine using [Amazon Web Services' Elastic Compute Cloud](https://aws.amazon.com/ec2/) (EC2) service.
You'll need to create an AWS account first if you do not already have one. To do this, navigate to this URL and click the "Create an AWS Account" in the top-right corner: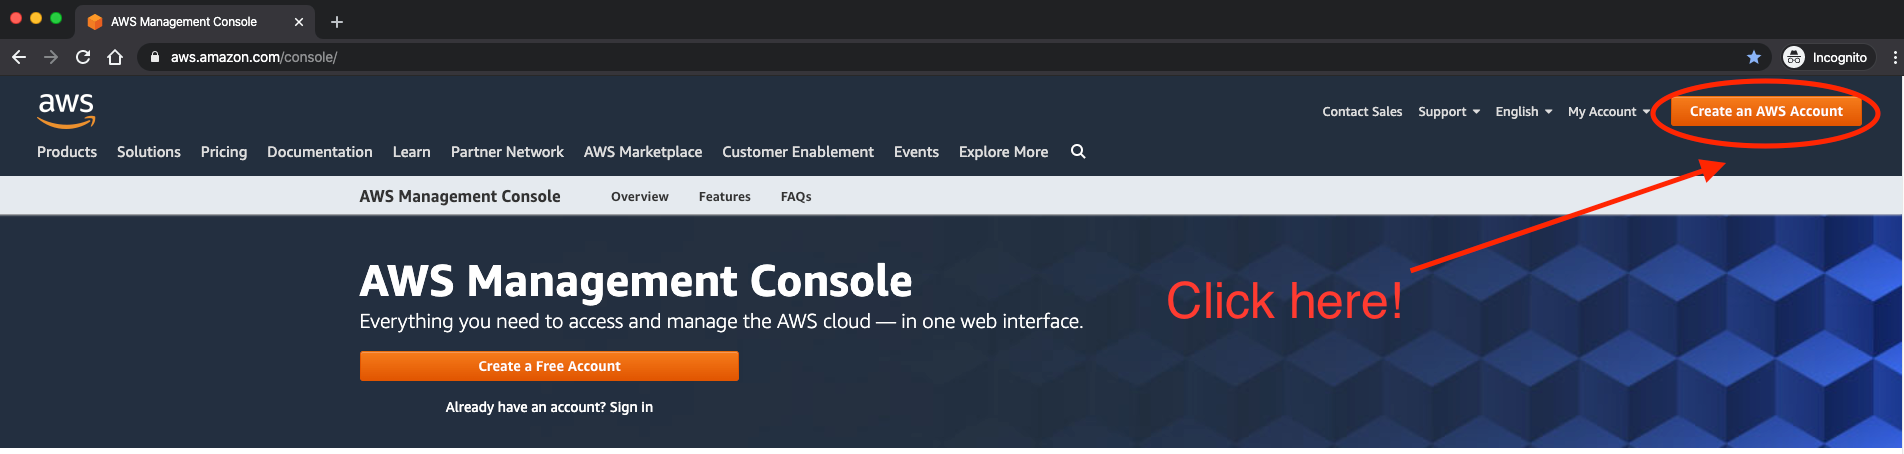
AWS' web application will guide you through the steps to create an account.
Once your account is created, you'll need to create an EC2 instance. This is simply a virtual server for running code on AWS infrastructure.
EC2 instances come in various operating systems and sizes, ranging from very small servers that qualify for AWS' free tier to very large servers capable of running complex applications.
We will use AWS' smallest server to run the Python script that we wrote in this article. To get started, navigate to EC2 within the AWS management console. Once you've arrived within EC2, click `Launch Instance`: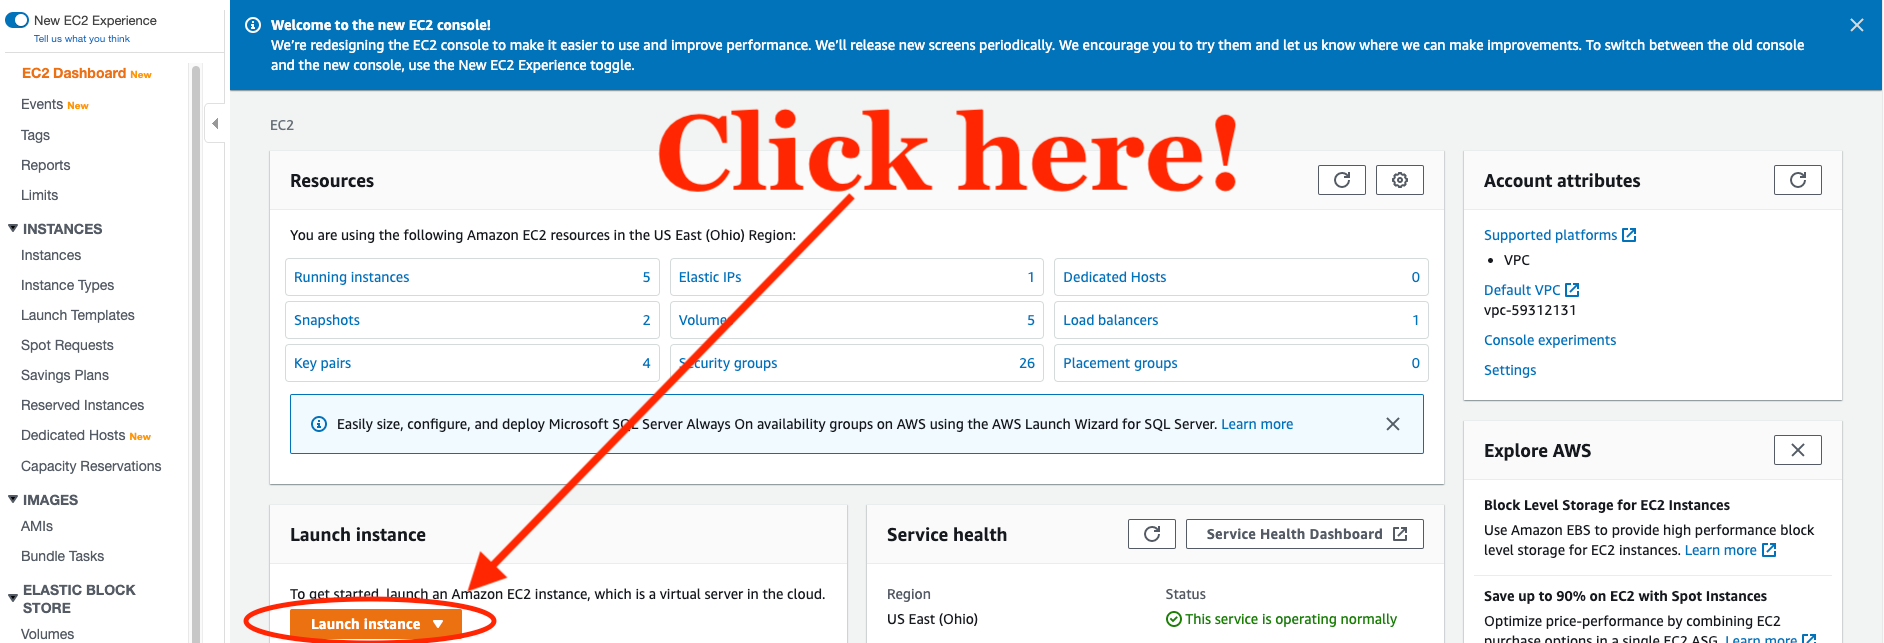
�This will bring you to a screen that contains all of the available instance types within AWS EC2. Any machine that qualifies for AWS' free tier will be sufficient.
I chose the `Amazon Linux 2 AMI (HVM)`:
Click `Select` to proceed.
On the next page, AWS will ask you to select the specifications for your machine. The fields you can select include:
* `Family`
* `Type`
* `vCPUs`
* `Memory`
* `Instance Storage (GB)`
* `EBS-Optimized`
* `Network Performance`
* `IPv6 Support`
For the purpose of this tutorial, we simply want to select the single machine that is free tier eligible. It is characterized by a small green label that looks like this: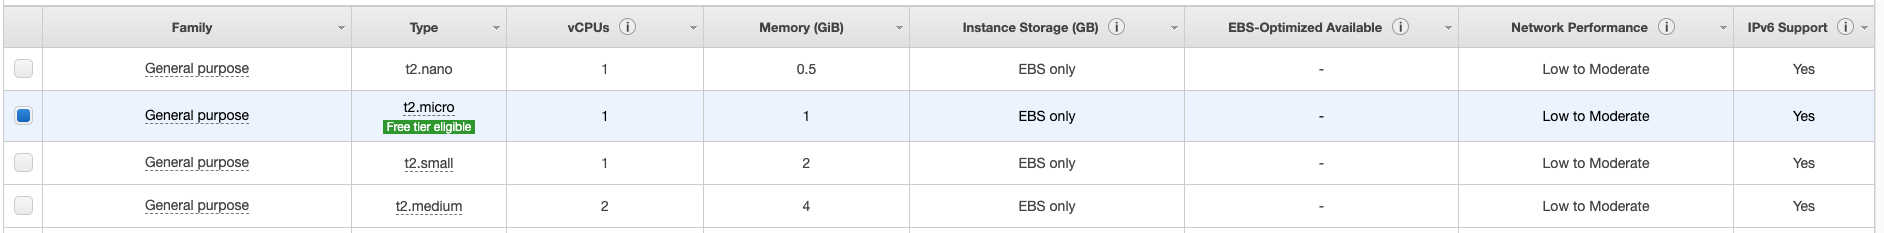
Once you have selected a free tier eligible machine, click `Review and Launch` at the bottom of the screen to proceed. The next screen will present the details of your new instance for you to review. Quickly review the machine's specifications, then click `Launch` in the bottom right-hand corner.
Clicking the `Launch` button will trigger a popup that asks you to `Select an existing key pair or create a new key pair`. A key pair is comprised of a public key that AWS holds and a private key that you must download and store within a `.pem` file. You must have access to that `.pem` file in order to access your EC2 instance (typically via SSH). You also have the option to proceed without a key pair, but this is **not** recommended for security reasons.
Once you have selected or created a key pair for this EC2 instance and click the radio button for `I acknowledge that I have access to the selected private key file (data-feeds.pem), and that without this file, I won't be able to log into my instance`, you can click `Launch Instances` to proceed.
Your instance will now begin to launch. It can take some time for these instances to boot up, but once its ready, its `Instance State` will show as `running` in your EC2 dashboard.
Next, you will need to push your Python script into your EC2 instance. Here is a generic command state statement that allows you to move a file into an EC2 instance:
```
scp -i path/to/.pem_file path/to/file username@host_address.amazonaws.com:/path_to_copy
```
Run this statement with the necessary replacements to move `stock_market_data.py` into the EC2 instance.
Trying to run `stock_market_data.py` at this point will actually result in an error because the EC2 instance does not come with the necessary Python packages.
To fix this, you can either export a `requirements.txt` file and import the proper packages using `pip`, or you can simply run the following:
```
sudo yum install python3-pip
pip3 install pandas
pip3 install xlsxwriter
```
Once this is done, you can SSH into the EC2 instance and run the Python script from the command line with the following statement:
```
python3 stock_market_data.py
```
### Step 4: Create an AWS S3 Bucket to Hold the Finished Python Script
With the work that we have completed so far, our Python script can be executed inside of our EC2 instance.
The problem with this is that the `xlsx` file will be saved to the AWS virtual server.
It is not accessible to anyone but us in that server, which limits its usefulness.
To fix this, we are going to create a public bucket on AWS S3 where we can save the `xlsx` file. Anyone who has the right URL will be able to download this file once this change is made.
To start, navigate to AWS S3 from within the AWS Management Console. Click `Create bucket` in the top right: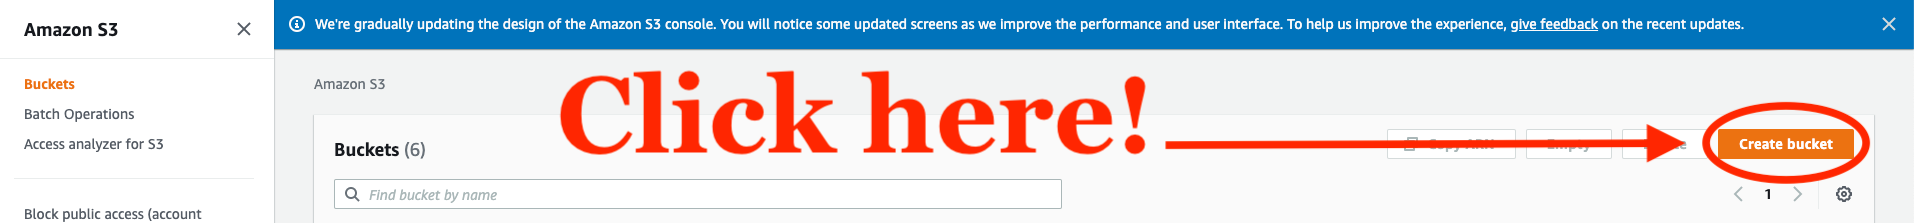
On the next screen, you will need to pick a name for your bucket and an AWS region for the bucket to be hosted in. The bucket name must be unique and cannot contain spaces or uppercase letters. The region does not matter much for the purpose of this tutorial, so I will be using the default region of `US East (Ohio) us-east-2)`.
You will need to change the Public Access settings in the next section to match this configuration: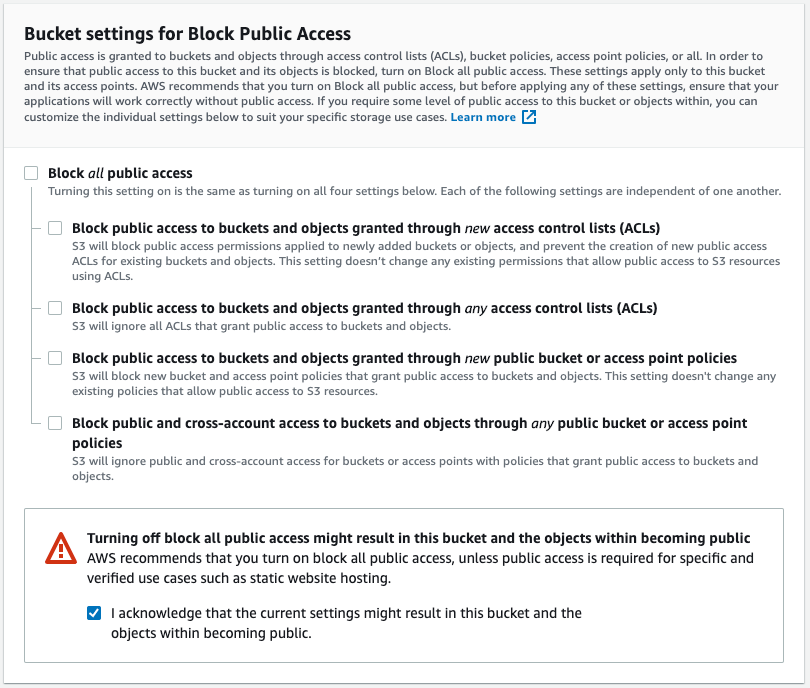
Click `Create bucket` to create your bucket and conclude this step of this tutorial!
### Step 5: Modify Your Python Script to Push the xlsx File to AWS S3
Our AWS S3 bucket is now ready to hold our finalized `xlsx` document. We will now make a small change to our `stock_market_data.py` file to push the finalized document to our S3 bucket.
We will need to use the `boto3` package to do this. `boto3` is the AWS Software Development Kit (SDK) for Python, allowing Python developers to write software that connects to AWS services. To start, you'll need to install `boto3` on your EC2 virtual machine. Run the following command line statement to do this:
```
pip3 install boto3
```
You will also need to import the library into `stock_market_data.py` by adding the following statement to the top of the Python script.
```
import boto3
```
We will need to add a few lines of code to the end of `stock_market_data.py` to push the final document to AWS S3.
```
s3 = boto3.resource('s3')
s3.meta.client.upload_file('stock_market_data.xlsx', 'my-S3-bucket', 'stock_market_data.xlsx', ExtraArgs={'ACL':'public-read'})
```
The first line of this code, `s3 = boto3.resource('s3')`, allows our Python script to connect to Amazon Web Services.
The second line of code calls a method from `boto3` that actually uploads our file to S3. It takes four arguments:
* `stock_market_data.xlsx` - the name of the file on our local machine.
* `my-S3-bucket` - the name of the S3 bucket that we're uploading our file to.
* `stock_market_data.xlsx` - the desired name of the file within the S3 bucket. In most cases, this will have the same value as the first argument passed into this method.
* `ExtraArgs={'ACL':'public-read'}` - this is an optional argument that tells AWS to make the uploaded file publicly-readable.
### Step 6: Schedule Your Python Script to Run Periodically Using Cron
So far, we have completed the following:
* Built our Python script
* Created an EC2 instance and deployed our code there
* Created an S3 bucket where we can push the final `xlsx` document
* Modified the original Python script to upload the finalized `stock_market_data.xlsx` file to an AWS S3 bucket
The only step that is left is to schedule the Python script to run periodically.
We can do this using a command-line utility called `cron`. To start, we will need to create a `cron` expression that tells the utility when to run the code. The [crontab guru](https://crontab.guru/) website is an excellent resource for this.
Here's how you can use crontab guru to get `cron` expression that means `every day at noon`:

Now we need to instruct our EC2 instance's `cron` daemon to run `stock_market_data.py` at this time each day.
To do this, we will first create a new file in our EC2 instance called `stock_market_data.cron`.
Open up this file and type in our cron expression followed by the statement that should be executed at the command line at that specified time.
Our command line statement is `python3 stock_market_data.py`, so here is what should be contained in `stock_market_data.cron`:
```
00 12 * * * python3 stock_market_data.py
```
If you run an `ls` command in your EC2 instance, you should now see two files:
```
stock_market_data.py stock_market_data.cron
```
The last step of this tutorial is to load `stock_market_data.cron` into the `crontab`. You can think of the `crontab` as a file that contains commands and instructions for the `cron` daemon to execute. In other words, the `crontab` contains batches of `cron` jobs.
First, let's see what's in our `crontab`. It should be empty since we have not put anything in it! You can view the contents of your `crontab` with the following command:
```
crontab -l
```
To load `stock_market_data.cron` into the `crontab`, run the following statement on the command line:
```
crontab stock_market_data.cron
```
Now when you run `crontab -l`, you should see:
```
00 12 * * * python3 stock_market_data.py
```
Our `stock_market_data.py` script will now run at noon every day on our AWS EC2 virtual machine!
### Final Thoughts
In this article, you learned how to create automatically-updating Excel spreadsheets of financial data using Python, IEX Cloud, and Amazon Web Services.
Here are the specific steps we covered in this tutorial:
* How to create an account with IEX Cloud
* How to write a Python script that generates beautiful Excel documents using pandas and XlsxWriter
* How to launch an AWS EC2 instance and deploy code on it
* How to create an AWS S3 bucket
* How to push files to an AWS S3 bucket from within a Python script
* How to schedule code to run using the `cron` software utility
This article was published by Nick McCullum, who [teaches people how to code on his website](https://www.nickmccullum.com/).
Reference :
---
# Agent Instructions: Querying This Documentation
If you need additional information that is not directly available in this page, you can query the documentation dynamically by asking a question.
Perform an HTTP GET request on the current page URL with the `ask` query parameter:
```
GET https://yo-sarawut.gitbook.io/tutorials/examples/finance/create-auto-updating-excel-of-stock-market.md?ask=
```
The question should be specific, self-contained, and written in natural language.
The response will contain a direct answer to the question and relevant excerpts and sources from the documentation.
Use this mechanism when the answer is not explicitly present in the current page, you need clarification or additional context, or you want to retrieve related documentation sections.